
- Dogecoin’s strongest support forms near $0.081–$0.083 as 27.4 billion DOGE clusters in the largest cost-basis zone noted in current market data.
- Exchange outflows rose sharply in late 2025, showing renewed accumulation activity during a period when price trades close to the $0.20 region.
- A descending broadening wedge on the 4-hour chart guides short-term structure as DOGE approaches resistance with expanding volatility across swings.
Dogecoin enters a period of compressed trading as new on-chain data shows heavy support and renewed accumulation activity across multiple price zones. The latest charts signal shifting holder behavior while short-term structure tightens.
$DOGE Cost-Basis Concentrations Shape Market Structure
Dogecoin $DOGE analysis from Ali Charts shows a deep concentration of supply at two key cost-basis zones. The largest cluster sits near $0.081–$0.083, where 27.4 billion DOGE were accumulated.This zone forms the strongest support on current charts.
A second band around $0.20–$0.204 contains roughly 12.1 billion DOGE. This area acts as a pressure point as many holders purchased near this level and may wait for price recovery. These layers compress trading conditions and help define near-term boundaries.
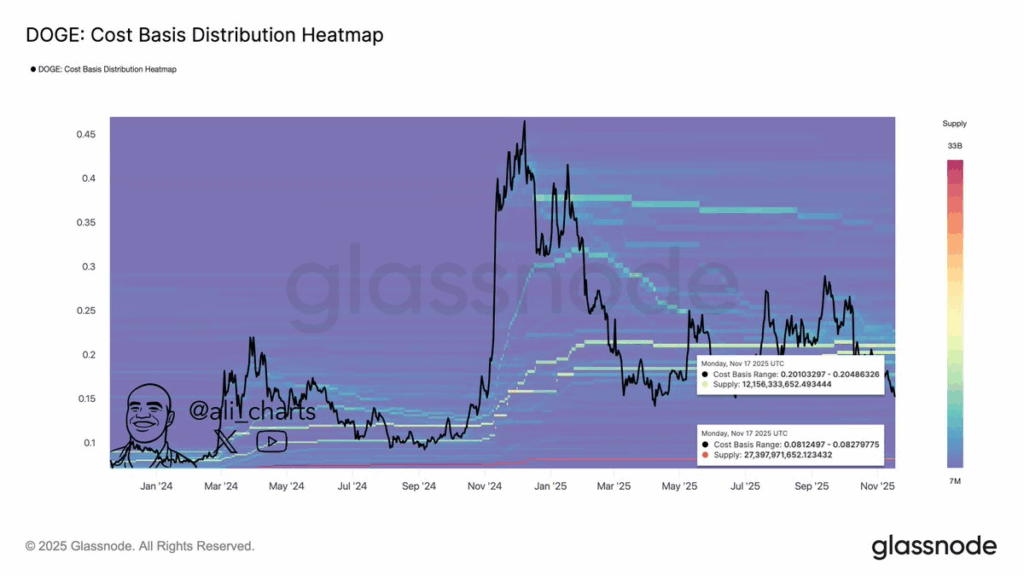
Price behavior through 2025 also reflects interaction with clusters in the $0.12–$0.18 range. Trading activity in this corridor suggests ongoing movement of supply as older positions leave the market and new entrants take their place.
Exchange Balances Show Renewed Outflows in Late 2025
A separate post from Ali Charts tracks DOGE’s Exchange Net Position Change. The chart records a shift toward positive net outflows late in the year, with a sharp green spike appearing as price trades near the $0.20 region.
During the 2024 rally toward $0.45, outflows were strong and supported long-term positioning. As price fell into early 2025, exchange inflows increased, showing that holders were moving DOGE toward trading venues as sentiment weakened.
The recent reversal toward outflows arrives during a period of softer price movement. This pattern may suggest a transition in holder behavior as supply leaves exchanges while the market trades within a narrow band.
Widening Structure Forms on the 4-Hour Chart
A descending broadening wedge appears on the 4-hour DOGE/USD chart. Price continues to touch both trend boundaries as volatility expands and traders react to each swing. The pattern remains active while DOGE moves between lower lows and lower highs.
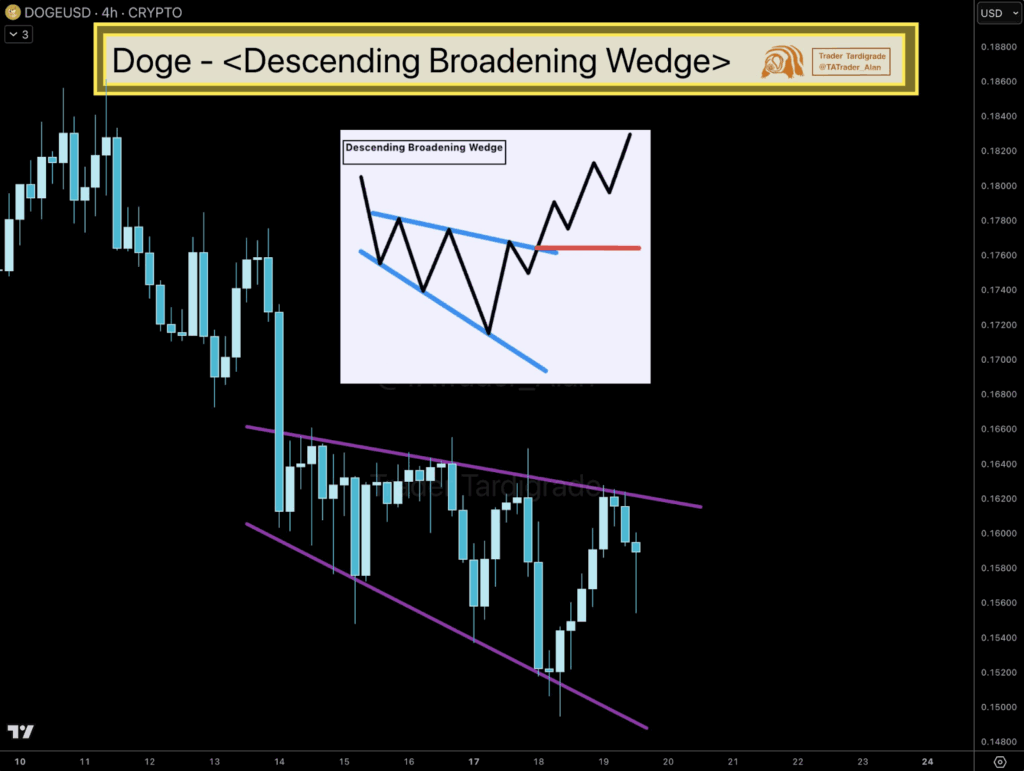
The market is now approaching the upper boundary of the structure. Buyers will need a clear move through the top trendline, supported by firm volume, to validate a shift toward higher levels around $0.165–$0.17.
However, rejection at resistance would keep the structure intact. In that scenario, price could rotate back toward $0.152–$0.154, where buyers have previously shown interest. The widening formation leaves room for stronger moves once a breakout appears.