
- Dogecoin recently tested the 200 EMA, which has produced higher highs and lows in the current bullish phase.
- Buff Doge Coin shows a mid-year surge followed by a correction, indicating consistent market participation.
- Dogecoin’s moving averages reveal renewed downside alignment, with price holding near $0.177.
Dogecoin’s market performance continues to attract close observation from traders after multiple tests of its long-term support zone. According to analyst Kevin, the cryptocurrency has touched the weekly 200 EMA six times this cycle, each time rebounding within its ongoing bullish structure.
This behavior aligns with Dogecoin’s pattern of maintaining higher highs and higher lows throughout the current bull phase. The data shows price movement recovering within a rising channel, as broader timeframes like the 3D and 1W continue to reset momentum.
Extended Correction and Return to Key Support Levels
In 2021 and 2023, Dogecoin remained in a downward pattern characterized by lower highs and lower lows, confirming a sustained contraction. The price stabilized near the $0.05 to $0.06 range, forming a base that set the foundation for future growth.
By early 2024, there was a breakout from this long decline, showing a structured upward channel. Within this range, it formed a sequence of higher peaks extending toward mid-2025 before pulling back toward $0.18.
During this movement, the 200 EMA acted as a recurring support, declining through each correction. The blue moving average, located near the mid-section of the price structure, served its role as both support and resistance during several retests.
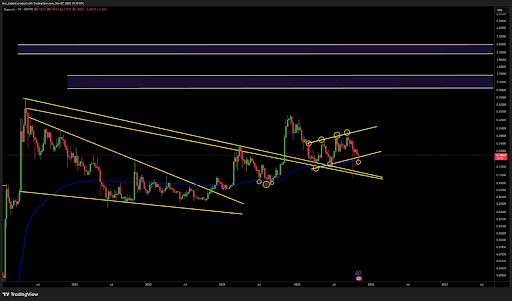
Two major resistance zones remain visible between $0.95 and $1.30, and between $2.30 and $3.00, marking potential upper boundaries of previous market cycles.
Buff Doge Coin Displays a Mid-Year Rally and Technical Adjustment
In 2025, Buff Doge Coin paired with Tether recorded a long consolidation phase followed by a breakout in June. Prices surged from 0.27e-8 to a peak of 0.35e-8 in August before correcting toward 0.26e-8 by November.
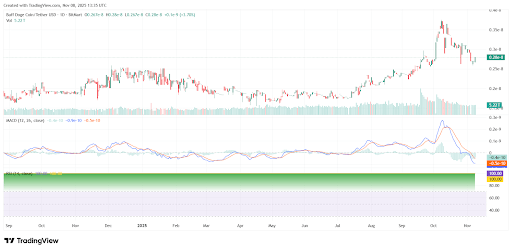
Momentum data from the MACD showed a clear bullish period followed by a downward crossover in late September. Trading volumes remained consistent, while the RSI maintained extended readings around 100.00, indicating strong market activity despite cooling momentum.
Dogecoin’s Moving Averages Indicate Renewed Bearish Alignment
A separate daily chart from Santiment shows Dogecoin’s 50-day and 200-day moving averages, which define the mid-2025 trend. Between May and June, the token declined from $0.26 to $0.16 before a rebound lifted prices to $0.29 by early September.
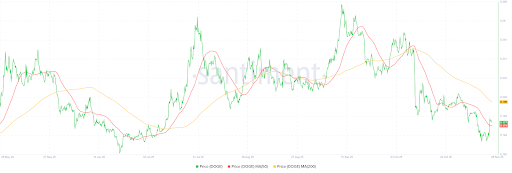
However, by October, the short-term average crossed below the long-term one again, signaling a renewed decline toward $0.177. Both averages now slope downward, showing persistent selling pressure even as short-term rebounds attempt to stabilize price action.