
Key Insights:
- Dogecoin recovers 5%, surpassing the $0.15 level amid a broader market recovery.
- 21Shares files for Dogecoin ETF, fueling institutional interest and adoption.
- The falling wedge pattern on DOGE’s chart signals potential for a breakout and upward momentum.
Dogecoin (DOGE) has experienced a strong recovery, rising 5% in the last 24 hours after a sharp decline. The price recently crossed the $0.15 mark, signaling a potential rebound for the meme coin. With market activity increasing and more buyers entering the space, DOGE appears to be enjoying renewed interest as the cryptocurrency sector recovers.
In the past two days, Dogecoin has gained more than 10%, supported by levels between $0.13 and $0.15. This increase comes alongside a broader recovery in the cryptocurrency market, which has seen other coins also make notable gains. The rise in trade volume signals that buyers are returning, pushing Dogecoin towards higher levels. As of December 3, DOGE surged to $0.1505, and the Relative Strength Index (RSI) reading of 61.49 reflects a bullish outlook for the coin.
ETF Filing Sparks Adoption Interest
Dogecoin’s outlook is also positively influenced by the growing interest in spot ETFs. 21Shares recently submitted its fifth amended filing for a Dogecoin ETF, signaling institutional interest. The ETF will be listed on Nasdaq under the ticker TDOG and will track the CF Dogecoin-Dollar US Settlement Price Index. The move adds another layer of legitimacy and potential growth for Dogecoin as it gains traction with investors.
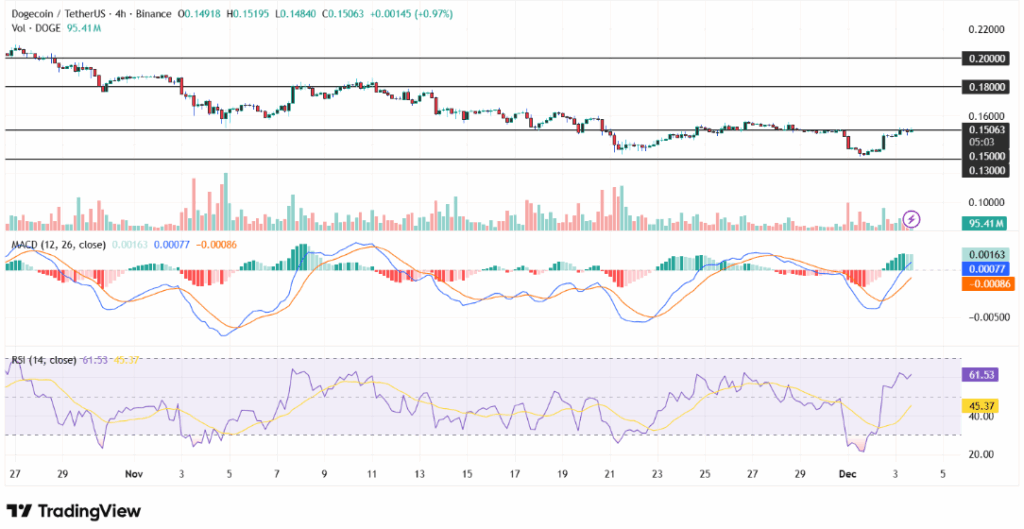
Technical analysts are closely watching a falling wedge pattern that has formed on Dogecoin’s price chart. This pattern, with converging trendlines acting as dynamic support and resistance, suggests a potential breakout. If the price breaks through the upper trendline, it could signal a shift in the market’s direction, allowing for further upward movement. Traders are monitoring this closely as a key signal for a breakout.
Key Resistance Levels to Watch
Dogecoin’s path forward faces key resistance levels around $0.16 and $0.18. A successful breakout above these levels could set the stage for a move towards the $0.20 mark. The Moving Average Convergence Divergence (MACD) has also shown favorable signals, with the MACD line crossing above the signal line, indicating more positive movement. While these indicators suggest a bullish scenario, a pullback to the $0.13 or $0.15 support zones remains a possibility if the upward momentum falters.