
- Dogecoin exhibits repeated historical cycles of accumulation,with potential upside based on past behavior.
- RSI is in the oversold levels near 30, indicating potential stabilization preparing for possible upward price movement.
- DOGEs strong community support and high daily trading volume, reinforces continued interest and participation in the market.
Dogecoin demonstrates recurring market patterns,which are reflecting its historical cycles of accumulation, parabolic rallies, and corrective downtrends.Analysts are closely monitoring these cycles to assess potential price movements in upcoming phases.
Historical Cycles and Price Patterns
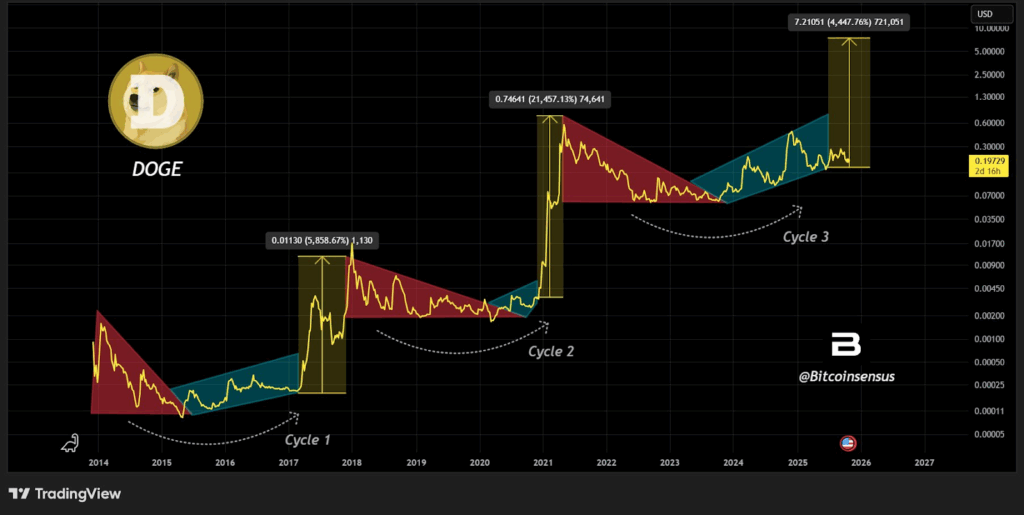
Dogecoin’s historical charts illustrate three major market cycles since 2014, each starting with a prolonged accumulation phase. The early stages, marked in blue, show extended consolidation periods before prices begin upward movements.
Analysts track these phases to anticipate potential breakout points.The first cycle witnessed DOGE rising around 5,800%, establishing early volatility expectations.
Cycle two saw unprecedented gains exceeding 21,000%, peaking at $0.74, largely driven by retail enthusiasm and social media attention. These cycles demonstrate Dogecoin’s repeated behavior of sharp upward momentum followed by multi-year stabilizations.
Cycle three suggests DOGE may be forming a similar accumulation structure, with a projected target box reaching $7. This projection depends on historical symmetry and does not account for new macroeconomic factors. These market regulations could alter the trend.
Short-Term Price Movements and Technical Indicators
Dogecoin is in a clear downtrend and the RSI is hovering around the low 30s approaching oversold conditions.Historically, this range has preceded temporary price stabilization and minor relief bounces signaling weakening buyer interest.
An intraday decline from $0.15 to $0.137–$0.138 was observed, marked by controlled trading early and a sudden breakdown later. The pattern reflects heavy selling or liquidity events, followed by price stabilizing without a significant rebound.
When DOGE dropped below $0.1495, it moved from consolidation into a downward trend. During this decline, about 1.56 billion DOGE tokens were traded, roughly 6.5 times the normal daily volume.
This points to algorithmic sales or liquidations rather than normal retail activity. Resistance at $0.1383 continues to limit recovery.
Market Overview and Community Perspective
Dogecoin remains the seventh-largest cryptocurrency by market capitalization, valued at $22 billion with roughly $1 billion traded daily on centralized exchanges. Its community emphasizes accessibility and engagement, with a mission to “Do Only Good Everyday.”
Bitcoinsensus noted that DOGE could follow past parabolic phases if historical patterns repeat, possibly reaching new highs.Accumulation trends, RSI levels, and trading volume to give strength of rallies or corrections.
The crypto shows cyclical price movements, sharp intraday changes, and periods of consolidation. Traders and the community watch technical signals and market structure to follow potential price movements.