
- DOGE holds above descending triangle support on the 3-day chart, signaling buyer defense and pattern intact.
- Compressed volatility and repeated rebounds suggest a potential bounce, with resistance clustered from $0.17–$0.35.
- Clear risk-reward: support near $0.14, upside targets span $0.155 to $0.47 if trendline breaks.
Dogecoin continues to trade near a key technical level as market participants monitor price behavior on higher timeframes. Recent chart data places focus on a long-standing descending triangle structure. Analysts reference defined support, measured volatility, and steady participation while price holds above the lower boundary on the 3-day timeframe.
Price Structure and Descending Triangle Context
Dogecoin is holding above the lower boundary of the descending triangle formation on the 3-day timeframe, according to chart data. The structure formed over several months with lower highs pressing against a flat support area near $0.14. Price compression increased as volatility gradually narrowed within the pattern.
According to analysis prepared by crypto analyst Jonathan Carter, Dogecoin is testing critical support at the triangle base. Carter stated that price continues to react from this level without a sustained breakdown. Multiple rebounds from the same zone confirm repeated buyer defense during recent market sessions.
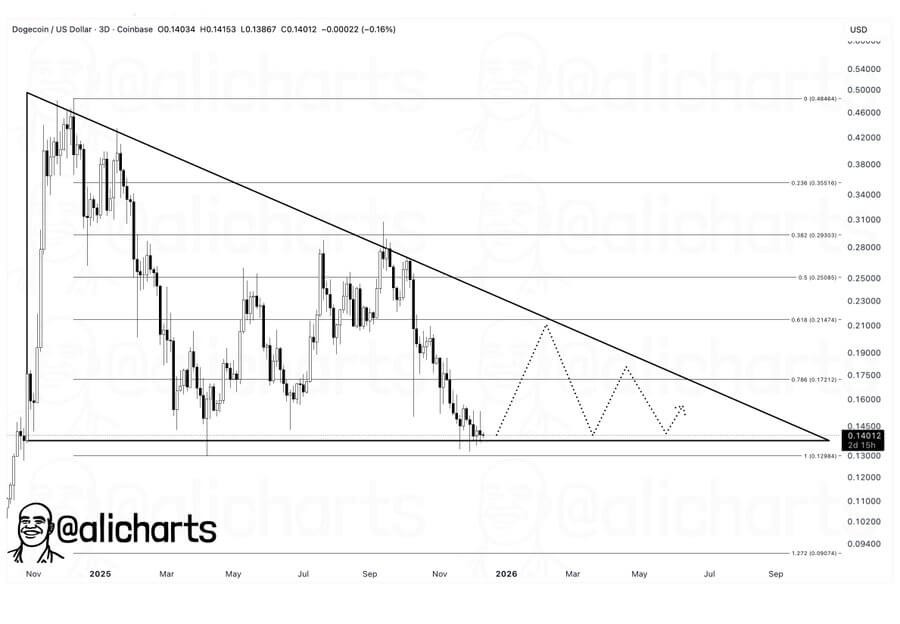
Candlestick behavior shows stabilization after a prior downside wick, with recent closes maintaining position above support. Fibonacci retracement levels mark overhead zones between $0.17 and $0.35. According to an observation by Ali Charts, DOGE appears to be trading in a triangle, and a rebound could push price toward $0.21.
Market Data, Risk-Reward, and Price Levels
The technical setup presents favorable risk-reward for buyers defending current levels, based on chart-defined boundaries. Support remains clearly visible, while overhead resistance aligns with the descending trendline. A successful bounce could trigger upward movement toward targets at $0.155, $0.190, $0.250, $0.310, $0.370, and $0.470.
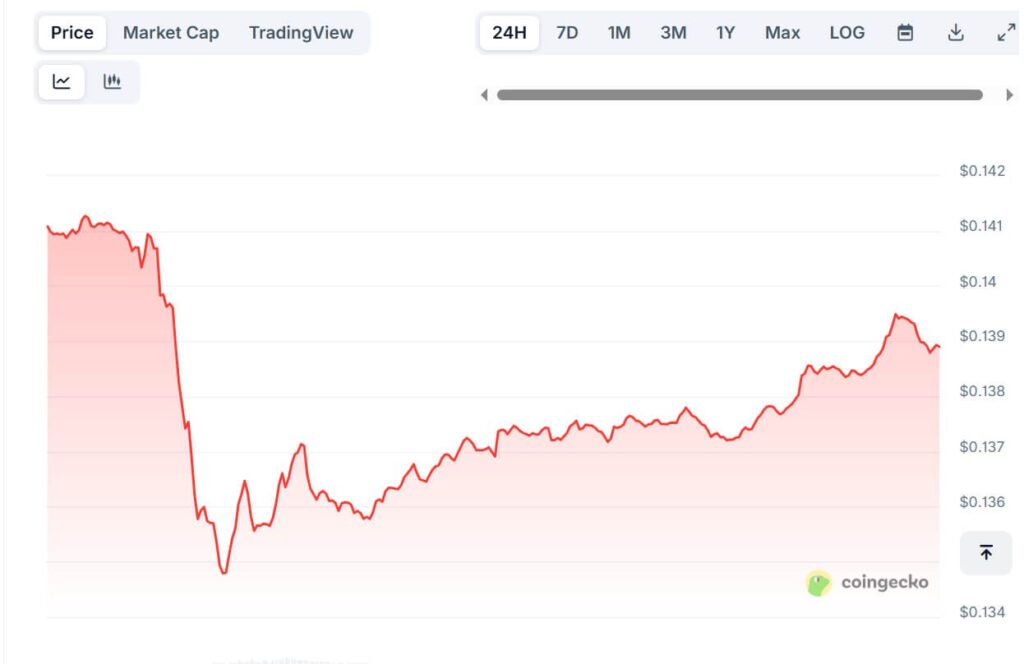
These levels correspond with historical reaction areas and prior consolidation zones on the chart. The first target near $0.155 aligns with short-term resistance inside the structure. Dogecoin trades at $0.1389, reflecting a 1.5% decline over the past 24 hours, according to CoinGecko data.
The 24-hour range spans between $0.1348 and $0.1413, showing active intraday movement. Market capitalization stands near $21.13 billion, with trading volume around $940 million. Circulating supply totals 152.13 billion DOGE, while total supply measures 167.87 billion tokens. Dogecoin ranks tenth by market capitalization, confirming strong relative positioning.