
- Dogecoin forms a clear Descending Broadening Wedge on LTF charts with widening price swings.
- Market data shows active trading near $0.160 as price moves through a full decline, recovery cycle.
- Downtrend structure remains visible while short-term stabilization appears with steady boundary reactions.
Dogecoin shows a bullish chart pattern on the lower-timeframe chart as the price moves inside a Descending Broadening Wedge. The pattern appears on the three-hour window and records widening swings between two diverging trendlines. The structure mirrors the standard model with steady volatility across the observed period.
Market Structure and Pattern Formation
Dogecoin trades inside the Descending Broadening Wedge while the upper trendline slopes downward and the lower trendline widens with each new swing. Price action touches both boundaries many times, and each movement builds a clear widening formation.
The comparison image shared by Trader Tardigrade shows the live chart matching the classic structure with near-identical swing points. Dogecoin trades at $0.1625 after a daily move that records a 1.5 percent decline, yet the 24-hour range between $0.1545 and $0.165 remains active.
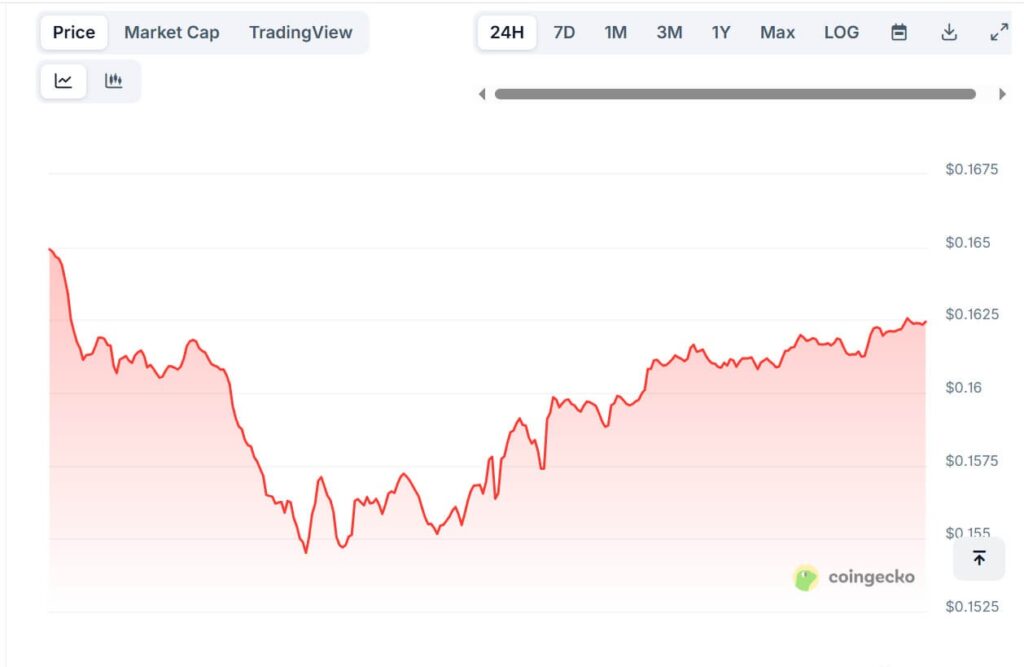
Data from CoinGecko places market cap at $24.64 billion, and the fully diluted valuation stands at $24.65 billion. Trading volume reaches $2.00 billion with steady participation, and circulating supply sits at 151.76 billion DOGE. The intraday chart opens near the upper band then moves toward $0.155 before a gradual rise develops and the session ends near $0.1625.
Downtrend Context and Current Stabilization
According to an observation by BitGuru, Dogecoin moved from a major high near $0.18311 into a steady downtrend. The chart records several corrective moves as the price moves lower and forms an intraday recovery to $0.16598 before returning to the downside.
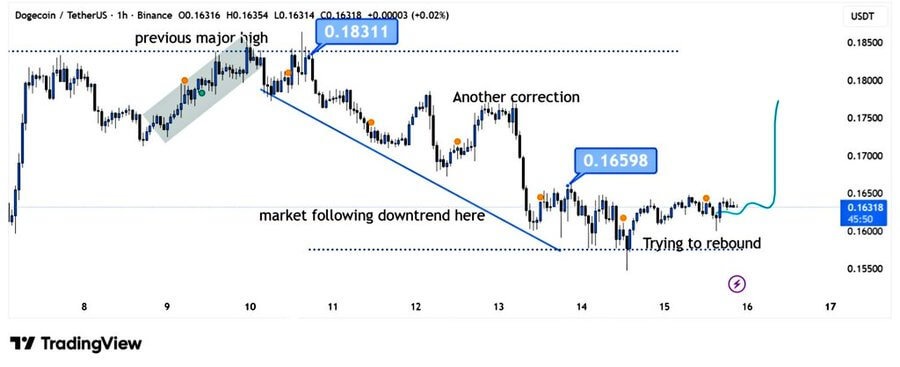
The market then holds steady near the $0.160 zone while buyers form a mild rebound attempt. Dogecoin now records sideways movement with small fluctuations as the asset trades in a tight range.
The chart shows an outlined path that marks a possible continuation route, and the Descending Broadening Wedge continues to guide short-term movement on the lower-timeframe chart. The formation remains active while the market records clear reactions along both trendlines, according to analysis prepared by Trader Tardigrade and observations shared by BitGuru.