
- Dogecoin’s $0.18 level remains a critical pivot, aligning with strong historical demand zones that previously triggered major bullish reversals.
- The TD Sequential indicator flashes a new buy signal, suggesting buyers may be regaining control at the channel’s lower boundary.
- Analysts compare Dogecoin’s current structure to its 2020–2021 pattern, with $0.2518 marked as the key breakout resistance level.
Dogecoin ($DOGE) is currently testing a crucial support level of $0.18 – a price region that would define its next major trend direction. Market experts are saying a hold of this level could set up an excellent rally and recover phase to visit higher resistance levels.
$0.18 Emerges as the Key Pivot Level
Crypto analyst Ali _charts emphasized that $0.18 serves as a crucial support for Dogecoin. According to his analysis, the asset continues to trade within a well-defined ascending parallel channel. The $0.18 level, positioned along the channel’s lower boundary, has repeatedly acted as a demand zone where previous rallies began.
Right now, Dogecoin is hovering slightly above this price, with buyers trying to keep it from sinking below this level. In terms of a technical setup, maintaining this support will embolden bullish sentiment and indicate the potential further upside opportunity. Ali’s dotted line projection illustrates that there may be a bounce first towards the midline resistance just above $0.26, and then again at the fabulous boosted price point of $0.33.
Alternatively, if the price falls below $0.18 and does not recover back above that price, that would invalidate the bullish structure and present lower potential targets close to $0.16 then $0.14. All traders are observing volume patterns and candle formations over the next few sessions to ensure the price travels in that direction.
Technical Indicators Suggest Renewed Buying Momentum
In regard to the outlook, Ali added the TD Sequential indicator has printed a buy signal for DOGE, a signal that tends to precede short-term trends reversals. The signal development coincides with price structure developing around the $0.18 region of support, which is already showing signs of support based on renewed buying interest.
The combination of technical price structure and momentum indicators has traders confident enough to expect a reversal of sorts. If buyers can establish and keep control, an attempt to rally toward the $0.26 resistance will set up, before then attempting to breach the upper resistance that is in the form of a local lump of supply just shy of $0.33.
It is likely that the next few daily candles will confirm whether the move is valid, or dissolve into consolidation. However, for now, participants continue to look on the higher time frames to provide clear bullish indications.
Long-Term Structure Resembles 2020–2021 Pattern
Crypto analyst Crypto_Paykash observed that Dogecoin’s broader chart structure mirrors its 2020–2021 rally phase. During that period, the coin broke out of an ascending triangle after forming a cup pattern, which eventually triggered an explosive price run.
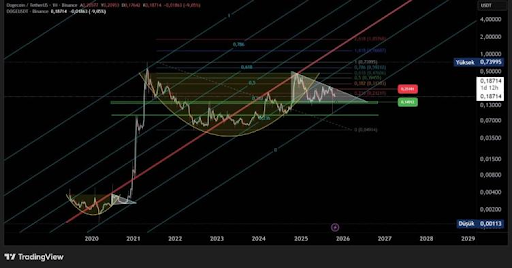
In this market cycle, we see a similar sequenced shape but over a longer time period. The analyst noted that $0.2518 was the critical breakout level when looking at the 0.382 Fibonacci retracement and $0.1490 was the major structural support.
This situation looks similar to what we saw before, and it has given rise to conversations among traders about whether the historical pattern will repeat under favorable market conditions. Nevertheless, directionally the markets have remained dependent on the $0.18 support zone, which continues to iidentify Dogecoin’s immediate trend outlook.