
- Dogecoin’s RSI has broken a key trendline, suggesting growing bullish momentum as it approaches critical resistance levels.
- A breakout above $0.115 resistance could propel Dogecoin toward a 45% price surge, targeting $0.160 based on the wedge pattern.
- Both the Ichimoku Cloud and MACD indicators show strengthening bullish signals, but moderate momentum remains a cautionary factor.
Ali Martinez, a crypto analyst on X, recently pointed out Dogecoin’s potential for a bullish breakout. According to Martinez, one of two conditions for the breakout has already been met, as the Relative Strength Index (RSI) broke above a descending trendline.
Now, the next key step is for Dogecoin to surge past the $0.11 resistance level. His analysis highlights the positive shift in market sentiment, as technical indicators align with bullish momentum.
RSI and Wedge Pattern Indicate Bullish Sentiment
The recent rise in Dogecoin’s RSI supports a potential breakout scenario. At the time of the writing, the RSI hovered between 50 and 60, indicating growing bullish strength. Notably, the RSI has broken above its descending trendline, reflecting an upward shift in momentum.
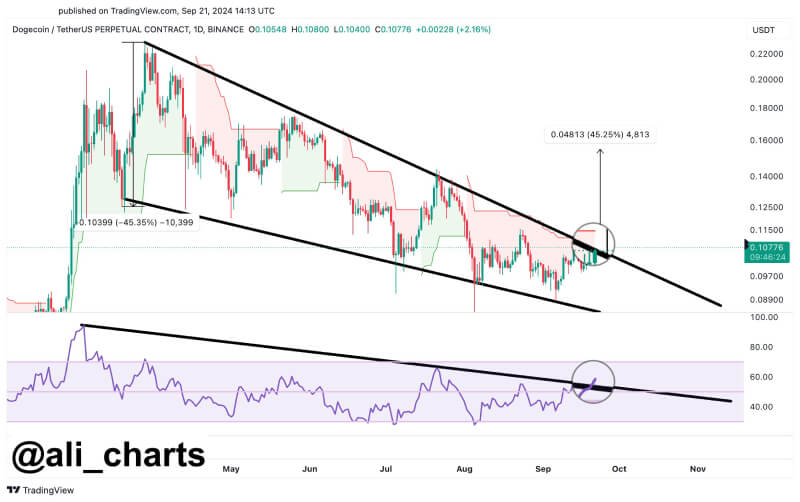
Additionally, Dogecoin has been trading within a descending wedge pattern, which is widely considered a bullish reversal formation. The wedge outlines a period of consolidation, where the price has been squeezed between two converging trendlines. Dogecoin has now broken above the upper resistance line, which occurred at around $0.10776.
Resistance and Support
The breakout from the wedge sets the stage for Dogecoin to potentially rally further. Currently, the price is facing a resistance at $0.115. If it sustains above this level, a target of $0.160 may be achievable, representing a potential 45% increase from current prices.
However, should the price fail to hold above $0.115, it could fall back to previous support levels near $0.097 or lower. The market is closely monitoring the $0.11 level as a critical resistance zone.
Market Indicators Signal Momentum Shift
In addition to the RSI, the Ichimoku Cloud and Moving Average Convergence Divergence (MACD) indicators show signs of strengthening momentum. Dogecoin has broken above the Ichimoku Cloud, signaling a possible shift from bearish to bullish market sentiment.
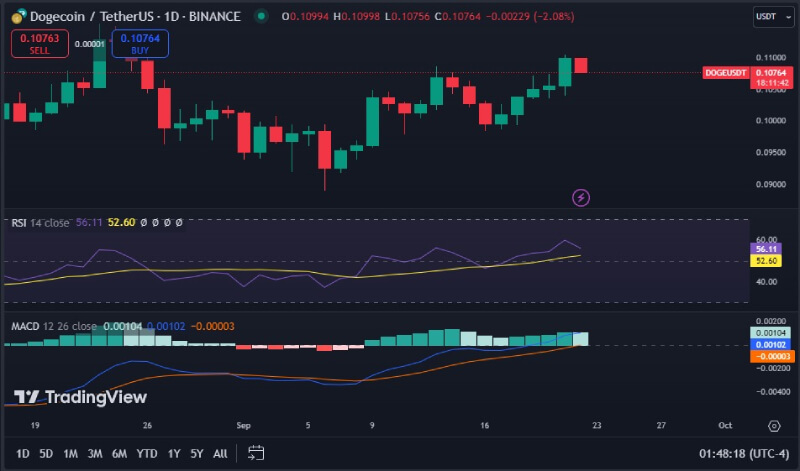
The MACD has also displayed a bullish crossover, where the MACD line crossed above the signal line, further indicating potential upward momentum. However, the current strength of the trend remains moderate, as shown by the small histogram bars on the MACD.