
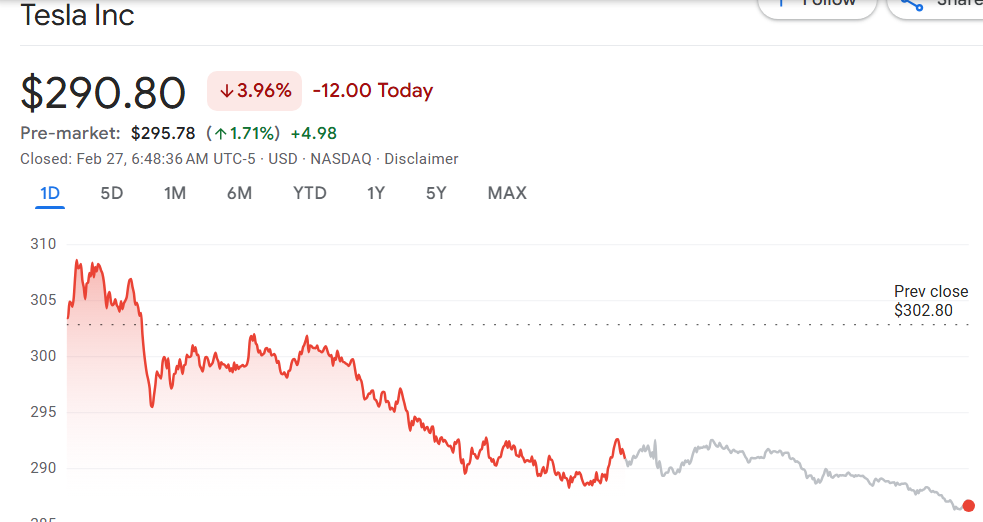
- After a descending triangle pattern broke below $380 Tesla stocks fell to $290.80 and experienced a 3.96% decrease. This indicated a powerful bearish market trend.
- RSI at 36.77 indicates that Tesla is moving toward oversold territory while negative MACD values show signs of short-term market recovery.
- Tesla faces crucial survival requirements to navigate upcoming challenges because increased market turbulence with economic factors add heavy selling pressure to its performance.
Tesla Inc. (NASDAQ: TSLA) has reached a key price target following a significant breakdown from a descending triangle pattern.The stock moved down sharply when it crossed the critical support level near $380 while trading inside a tightening pattern. The stock underwent a major sell-off due to this breakdown which caused Tesla’s share price to drop to $290.80 with a 3.96% reduction.

Source:Finance
Pattern Analysis and Market Reaction
The daily price chart of Tesla exhibits a descending triangle pattern that analysts interpret as a bearish continuation signal according to Ali’s analysis. When the price dropped below this support level selling pressure intensified therefore directing the stock price toward weaker valuation targets. Analysts have been monitoring this pattern closely, anticipating a potential downward move if Tesla failed to hold above the key support zone.
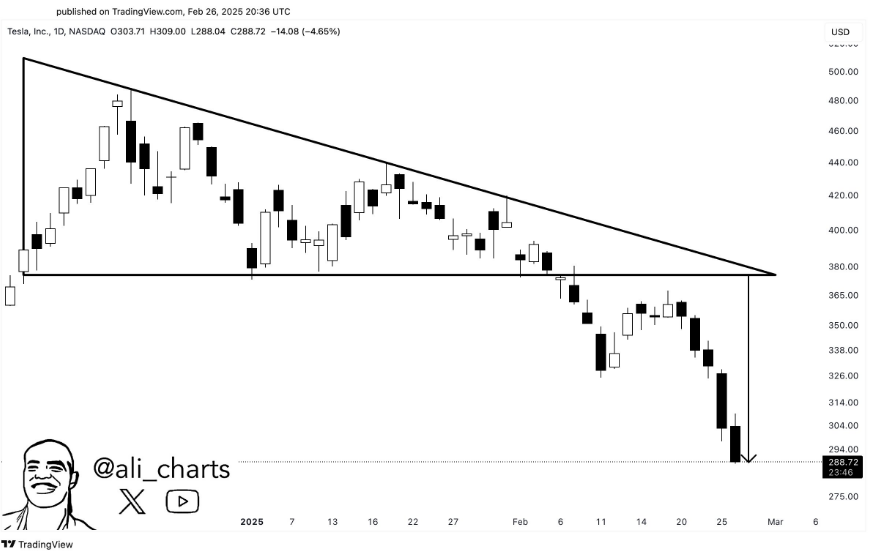
Source:Ali(X)
Market participants reacted swiftly to the breakdown, leading to increased trading volume and heightened volatility. The downward trend matches similar market patterns of fluctuating high-growth technology sectors under conditions of financial instability.
The current market position of Tesla creates doubt about its upcoming short-term performance. Technical indicators point towards persisting weakness in Tesla’s price movement but market participants watch for possible areas where the price might stabilize.
Tesla Stock Shows Bearish Momentum with Potential Rebound Signals
Tesla’s stock price is currently trading around $296.10 (sell) and $296.20 (buy), indicating a highly liquid market with a narrow spread. The MACD line is trading below the signal line showing negative momentum in the market.
Additionally, the RSI stands at 36.77 below 30 which signals the stock might be undervalued at the moment but shows potential for recovery.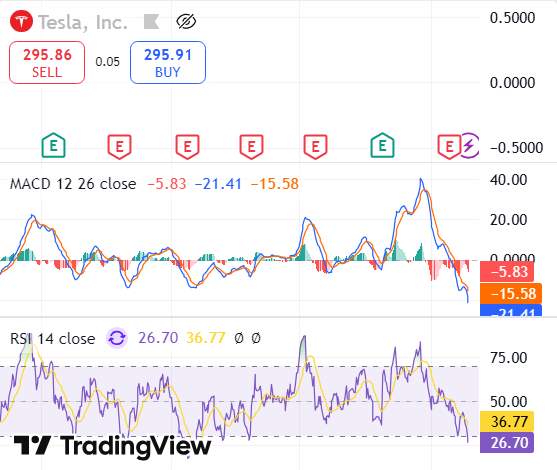
Source:Tradingview
Given the current technical indicators, Tesla’s stock is in a bearish phase, but with RSI in oversold territory, a short-term bounce may be possible if buying pressure increases. Thus,the market will monitor Tesla’s capability to handle stability and analysts will evaluate if the stock will recover or if the decline period will persist.