

- CRV price gains 1.37% on the 4-hour chart, with MACD and RSI showing increasing momentum and growing buyer participation.
- Market cap dipped below $1.01B but sharply recovered to $1.07B, indicating renewed demand and strong V-shaped recovery.
- Volume stands at 1.98M, backing the price rise from $0.75, signaling active accumulation during the recent bullish breakout.
CRV Price Analysis points to a crucial technical setup unfolding across timeframes, with traders watching closely for breakout confirmation. The price has compressed inside a falling wedge, while indicators remain mixed and volume behavior shifts.
Falling Wedge Pattern Faces Resistance from Key Moving Averages
Alpha Crypto Signal shared that CRV is forming a falling wedge on the daily chart, typically a setup for bullish reversals. At the moment, the price is at $0.7829 just below the 9 EMA $0.7831 and 50 SMA $0.9102, showing bulls are struggling. CRV is currently at $0.7657, which keeps the short-term outlook under bearish pressure.
The wedge has been narrowing since mid-August, suggesting a possible breakout could happen soon. To change sentiment, CRV needs to close above the $0.80–$0.82 level. Without that, downside risks remain, potentially driving the price to $0.70–$0.65. Volume remains subdued, which is common in wedge setups, but a spike would confirm any real breakout.
Weekly Chart Displays Sideways Channel and Momentum Weakness
The weekly CRV chart on Coinbase shows price action inside a wide sideways channel that has held since early 2023.CRV sits between a buy signal $0.7428 and a sell signal $0.7427, indicating no clear direction. The red volatility band continues to reject price moves, maintaining the range.
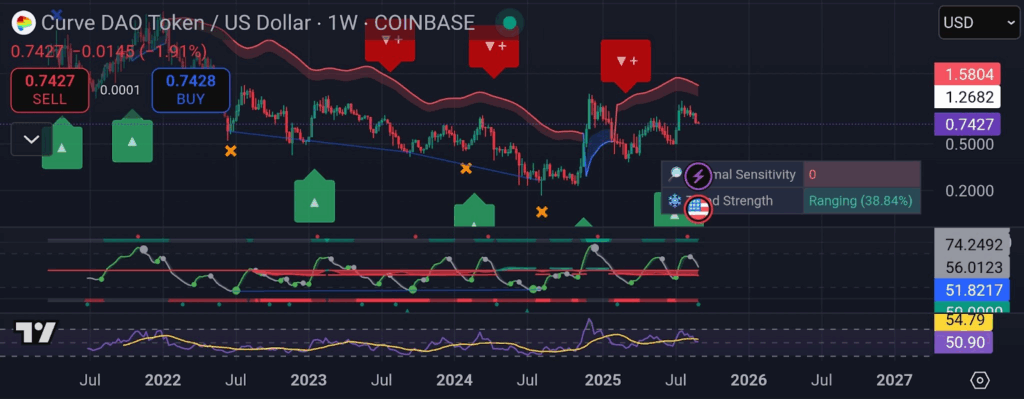
Relative Strength Index hovers around 50.90, which shows neither extreme buying nor selling. The stochastic oscillator appears to roll over, pointing to potential weakness. The Ranging Strength reads 38.84%, confirming a neutral structure. A weekly close above $1.00 would shift the long-term view into bullish territory.
Short-Term Chart and Market Cap Show Signs of Recovery
On the 4-hour chart, CRV has bounced from $0.75 and now trades at $0.7782, up 1.37% on the day. MACD has made a bullish crossover, and RSI is at 53.76, both show that momentum is building. Volume sits at 1.98 million, supporting the recent upward move.CRV’s market cap from August 28 to September 3 shows volatility followed by a recovery. The market cap rebounded to $1.07B by September 3. This V-shaped bounce signals buyers are active in the market.


