
- Ethereum led liquidations with $108M as aggressive leverage trading intensified volatility across the broader crypto market.
- Bitcoin dropped below $103K while ETH rebounded from $2,395, signaling strong buyer activity near critical liquidity zones.
- ETH eyes a breakout above $2,576 resistance after month-long accumulation, with targets set between $2,900 and $3,100.
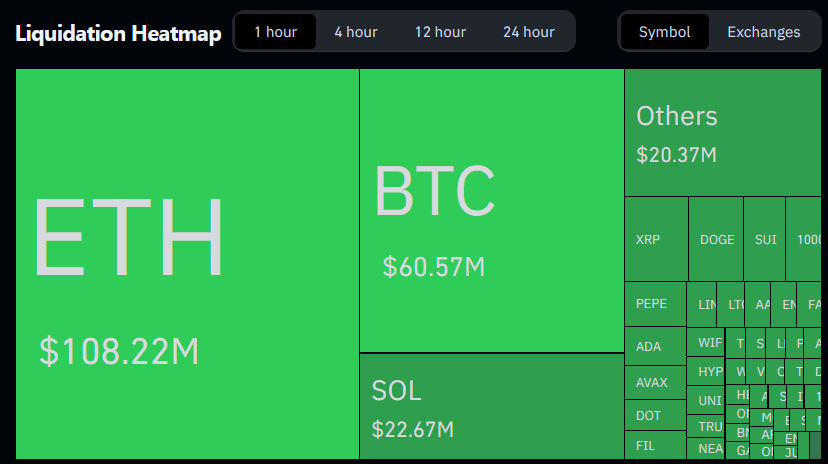
The crypto market experienced sharp turbulence as over $250 million in long positions were liquidated within hours. Bitcoin dropped below $103,000 while Ethereum briefly fell under $2,400. This extreme market movement led to widespread position closures and heightened volatility across major trading platforms. According to data, Ethereum led all assets with $108.22 million in total liquidations, followed by Bitcoin with $60.57 million. Solana came third, contributing $22.67 million to the liquidated total. Smaller-cap assets collectively added $20.37 million under the “Others” category, further emphasizing the market-wide pressure.

Ethereum Dominates Liquidations Amid Market Shakeup
Ethereum’s large liquidation figure signals aggressive leveraged trading and extreme volatility. The liquidation heatmap showed Ethereum holding the top spot in liquidation volume. This trend points to trading activity across ETH markets. Various altcoins including XRP, DOGE, and SUI also recorded visible liquidation spikes, although in smaller amounts.
Source: Coin Bureau
Moreover, the heatmap displayed the volume for each asset in proportion to its liquidation share. Platform-specific data allowed users to switch between exchanges and timeframes, including 1-hour to 24-hour views. Traders faced rapid position closures during high-volume sell-offs.
ETH Structure Signals Possible Breakout
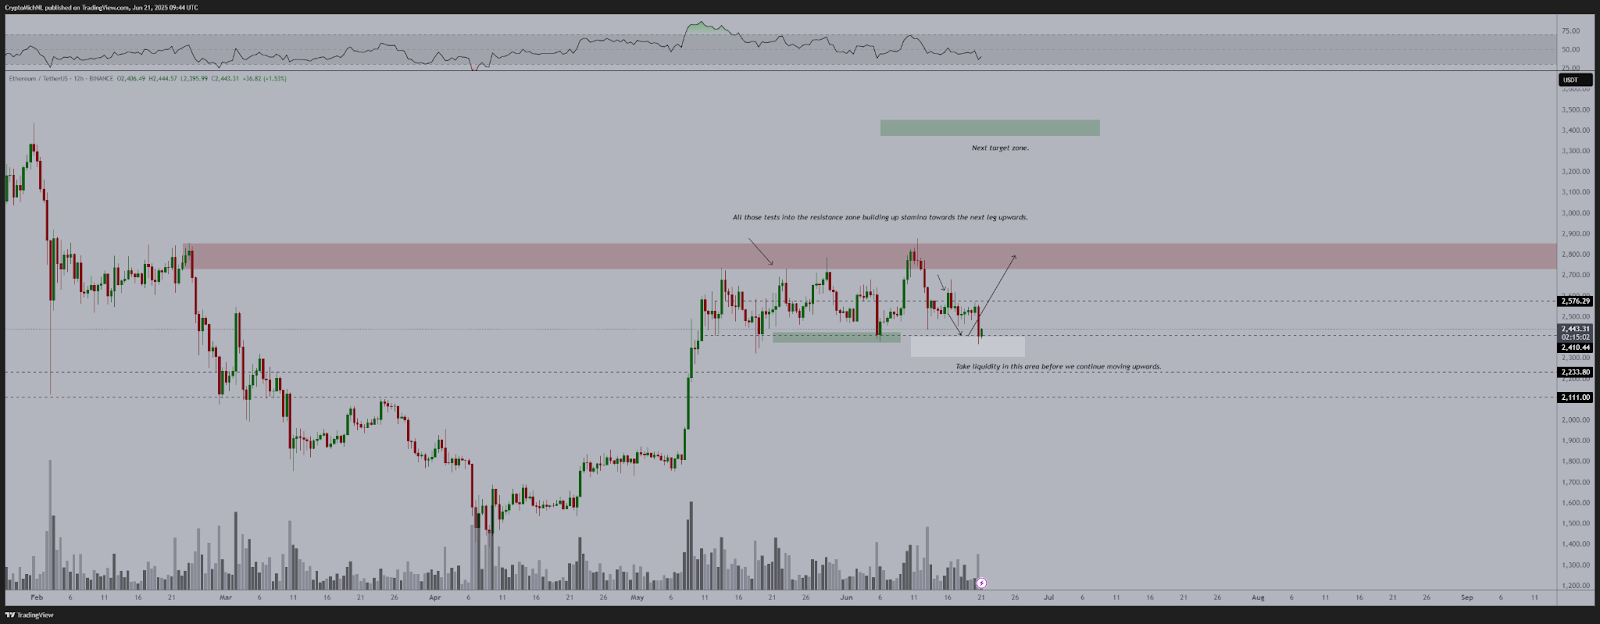
Despite the recent dip, Ethereum recovered swiftly and now trades around $2,443. It bounced from a support zone between $2,300 and $2,395. Buyers entered aggressively in this region, reversing the price from the local low. The liquidity zone between $2,111 and $2,395 provided a key reaction point.
Source: Michael van de Poppe
Besides, the resistance area between $2,576 and $2,730 remains crucial. Ethereum has tested this level multiple times without success. However, each attempt adds pressure just beneath resistance, setting the stage for a potential breakout. Volume increased during rallies, particularly around $2,395, confirming its strength as a reaction level.
Additionally, momentum indicators like RSI have cooled after recent highs, allowing for renewed buying energy. The next target zone lies between $2,900 and $3,100. Hence, breaking above $2,576 could unlock this upside. For now, Ethereum remains in accumulation as long as it holds above $2,300.