
- The TOTAL/USM1 ratio broke key resistance at 0.17, resembling past patterns that preceded major crypto bull markets in 2017 and 2021.
- Bitcoin dominance rose to 60.48% as institutional investors and ETF inflows continue to favor BTC over altcoins.
- Derivatives and spot ETF data show strong institutional bias toward Bitcoin, while altcoins face mixed demand and outflows.
The total crypto market cap appears to be undergoing its largest breakout yet when measured against the U.S. money supply. Data from a long term logarithmic analysis shows a key move that could influence the direction of the broader crypto market into 2026 and beyond.

According to analyst Javon Marks, a macro pattern that began forming after the 2021 cycle top appears to have resolved in mid-2024. The TOTAL/USM1 ratio, currently around 0.2, is climbing after breaching a key horizontal resistance zone of 0.16–0.17.
Historical precedents show that similar breakouts in 2016 and 2020 led to explosive rallies in digital assets. With the current breakout confirmed above prior structural resistance, analysts are closely tracking this shift for its potential impact on both Bitcoin and altcoins.
Altcoins Trail as Bitcoin Dominance Expands
Altcoins remain behind Bitcoin, despite some registering monthly gains. The CMC Altcoin Season Index is at 40 out of 100, indicating a Bitcoin dominant cycle. Bitcoin’s market dominance has climbed to 60.48%, up 0.28 points in just 24 hours.
Even as assets like BNB rose by 18.71% over the past 30 days, BTC’s consistent strength continues. This comes amid a broader capital shift toward Bitcoin, where institutional interest and ETF assets under management have grown significantly.
Notably, traders are concentrating funds into Bitcoin for now, seeking liquidity and regulatory clarity.
Derivatives Volume and Institutional Activity
Derivatives markets have shown a significant change toward Bitcoin. Daily perpetuals volume jumped 38.5% to $1.55 trillion, mostly favoring BTC with 87% of Binance taker buys. Open interest across all contracts increased by 9.5%, but demand for altcoins remained mixed.
ETH open interest rose by 2.17%, while SOL dropped by 5.3%. Institutions supported this trend. Spot BTC ETFs saw $450 million in inflows compared to $120 million for ETH. Altcoin funds, however, recorded net outflows of $79 million. Corporate balance sheets, including MicroStrategy’s $10 billion BTC position, reinforce this long-term bias.
Long Term Chart Patterns Indicate Structural Change
The TOTAL/USM1 ratio analysis covers market behavior since 2015. Each previous symmetrical triangle led to bull cycles in 2017 and 2021. Now, the current triangle, formed between 2022 and 2024, has broken to the upside, with a projected target beyond 2026.
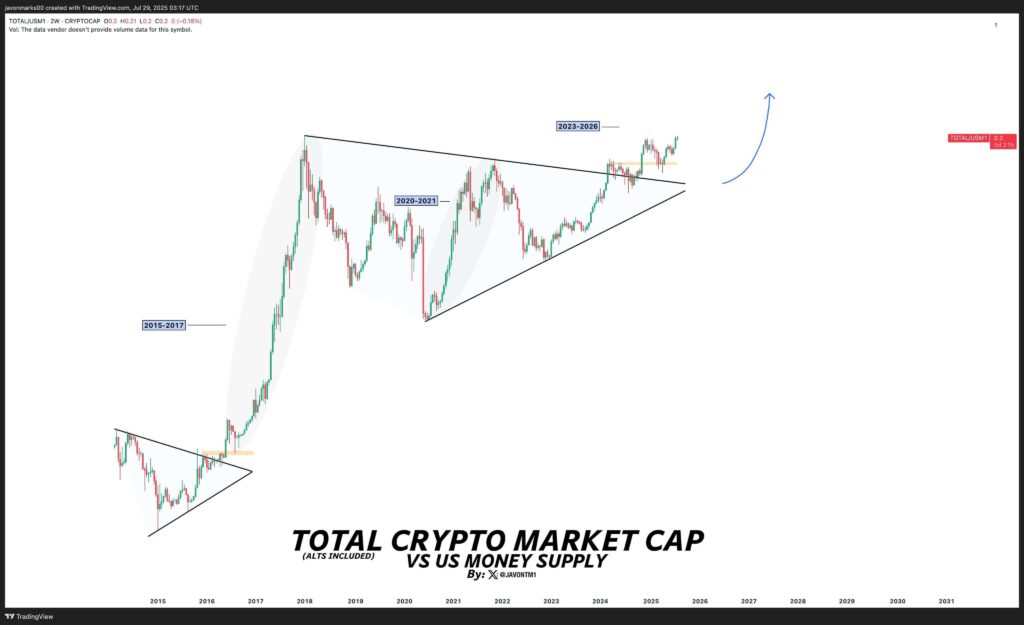
Blue trajectory markers in the chart imply a continuation of upward momentum, in line with previous breakouts. Key support zones, once resistance, now provide a base for this expanding cycle.
This breakout, backed by volume and structural confirmation, precedes the next macro phase. This breakout structure, rising Bitcoin dominance, and strong institutional flows together define the crypto market’s current position.