- CRV price is forming lower highs and higher lows, showing potential for a breakout soon.
- Volume decline is showing reduced market activity signalling a major move.
- Price recently rejected at the upper trendline and broke below the 9-period EMA.
CRV price is squeezing tight inside a classic triangle pattern.A breakout above $0.56 or a drop below $0.54 could spark a strong move, stirring fresh market action soon.
Symmetrical Triangle Indicates Upcoming Breakout
CRV/USDT chart shows a clear symmetrical triangle pattern. This happens when the price makes lower highs and higher lows, tightening the range. Trading volume has dropped, which usually happens before a big move.
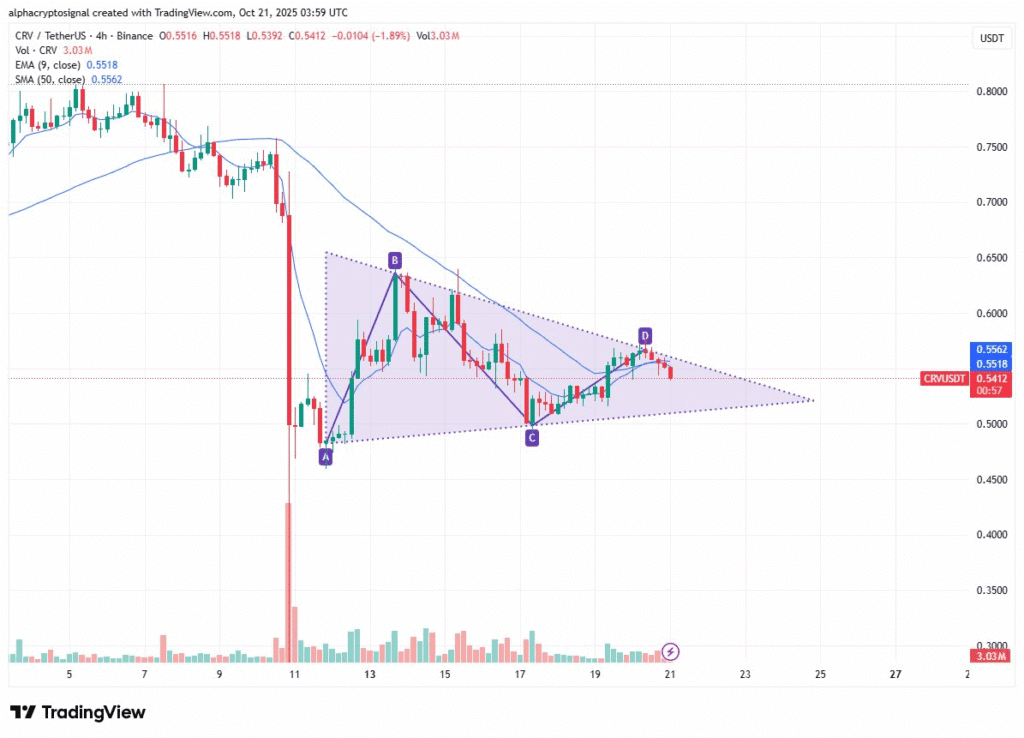
Due to short-term selling pressure the latest candle touched the upper trendline and then dropped below the 9-period EMA.
Resistance and Support Levels To Define Price Action
CRV is stuck between $0.54 and $0.56, if it drops below $0.54 this might extend the current downtrend.So it’s important for bulls to hold the $0.54 level to avoid deeper losses, because if this level holds, it could act as a strong base for a potential rebound.
Backed by multiple technical indicators like the volume-weighted average price (VWAP), point of control (POC), and the monthly pivot support. To shift momentum in their favor, bulls need to push the price above $0.65 and then $0.82 — and turn both into support.
That would open the door for a possible move toward $1. But for that to happen, trading volume needs to pick up and stay strong.With the altcoin market starting to recover, CRV could follow the trend — if buyers step in at the right levels.
Market Cap and Volume Reflect Investor Sentiment
The Curve DAO market cap chart shows volatility over the past week. Market cap peaked near $875 million around October 14–15 before falling sharply to about $700 million. The decline corresponds with price drops and likely profit-taking.
Following a brief rebound to above $775 million on October 19–20, the market cap fell below $750 million again. Volume data shows decreasing activity, which supports the symmetrical triangle pattern’s suggestion of market indecision.
Traders should monitor volume closely. A breakout with rising volume will give stronger confirmation of CRV’s next move. Until then, trend direction remains uncertain.