
- After descending into a low at $145, the price of $COIN is seen relatively close to this significant support level.
- The token is facing a very prominent resistance at $175 while trading with low overall volumes since around June of 2023.
- A bullish breakout should unfold with significant buying volume in the following weeks.
The chart above presents an alternate view of the recent price action of $COIN. After hitting a top early 2023, the asset went through some major moves with price consolidating within an upward-sloping channel. A potential accumulation around this level looks then likely for a breakout. The most recent chart shows that price is attempting to test the lower bounds of this channel where an opportunity for another comeback may arise, contingent upon strong participation by the bulls in the near term.
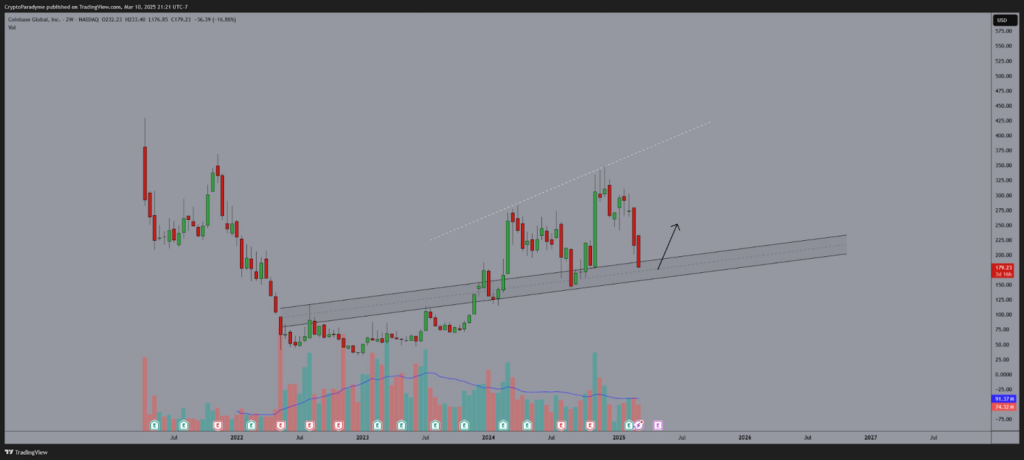
Price Actions and Market Position now
Thus says the chart about the price movements of $COIN since mid-2020 owing to a stirring flight on buying interest to $585.48, commencing downward correction in early 2021. A massive swing downwards saw the token enter a consolidation phase around the $150 level, trending upwards up to mid-2022.
By second-half 2023, price attempted another high before enjoying a healthy correction, presently residing around $150 to $175. Of keen interest is the fact that since mid-2023, volume bars have steadily declined, indicating not much on strong selling pressure but also reluctance of buyers to drive the price up into higher territory without a catalyst.
Key Trendlines and Support Levels
The chart also shows two prominent trendlines: a long-term support line drawn from the lows in 2022 and a resistance line that has capped price in 2023 and early 2024. Presently, the asset is sitting at the bottom of the channel, testing the area surrounding $145, an area that has been holding as support since mid-2023.
If, on the other hand, price goes below that area, a further downtrend can be expected towards $125, which is a key support zone seen years before. A bounce off that lower trendline, however, would affirm the preceding upward trend as possible, especially with increasing buying volume in the coming weeks.
Volume and Market Sentiment
Volume analysis suggests the market is in a standstill pattern. Volume flow has been declining over the past few months, implying indecision. Only a change in the market sentiment induced with substantial buying pressure would launch a rally. The price pattern and low volume render it highly vulnerable to fast moves in either direction. So investors should exercise caution and watch closely for signs of a volume spike that might indicate a change in market dynamics.