- Bitcoin trades at $115,572 with support at $114,755 and $111,918, while $103,190 demand zone signals possible accumulation.
- RSI weakness and volume spikes confirm corrective structure, with $116,813 retest needed for continuation toward $119,504 levels.
- Bitcoin dominance fell to 57.96% after rejection, with analysts eyeing 40–42% as potential trigger for altcoin outperformance.
Bitcoin price action has shifted downward after recent resistance rejections, with analysts noting zones where liquidity and support could determine the next move. Following a retracement from the $119,504–$118,000 resistance range, sellers absorbed demand, pushing the price toward lower supports.

According to analyst Michael van de Poppe, markets are undergoing a corrective phase, setting up potential “buy the dip” opportunities before a possible altcoin rally.
Resistance Rejection
Bitcoin is trading at $115,572, with immediate resistance around $116,813. Failure to retest this level may maintain downward pressure. Beneath current price action, support is at $114,755, followed by stronger protection near $111,918. A further decline could expose the green demand zone around $103,190, historically marked by accumulation.
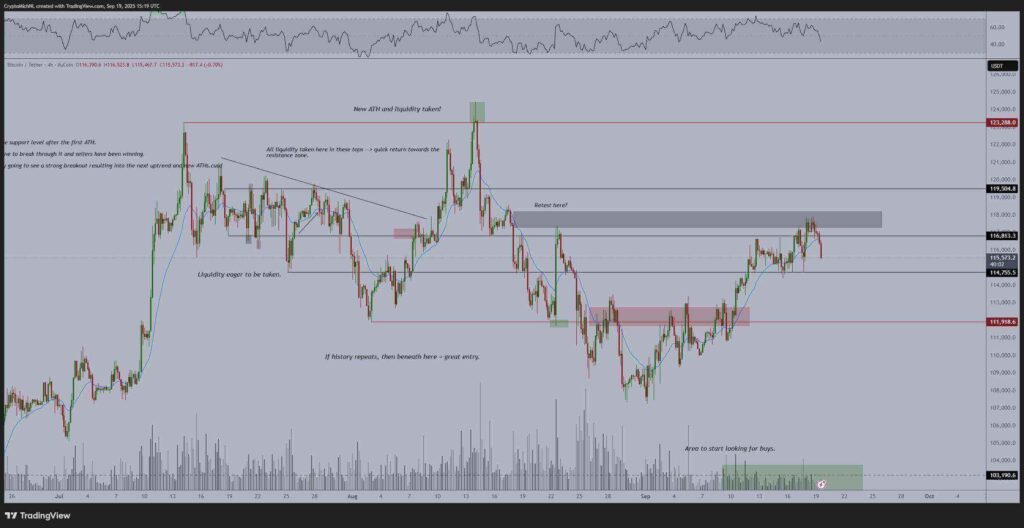
Liquidity analysis shows sharp moves toward pockets beneath prior consolidations, where stop orders often concentrate. Notably, volume activity has spiked around these levels, reinforcing the presence of smart money exploiting liquidity before reversals.
RSI Weakness
The RSI has recently shown weakness, aligning with rejection from resistance levels. This supports the corrective structure suggested by recent retracements. Analysts point to a retest of $116,813 as key for continuation toward $119,504 and possibly retesting all-time highs.
However, if support at $114,755 fails, price could extend losses toward $111,918. A breach of this level would increase the probability of testing $103,190, where demand has previously strengthened. Such moves would align with the broader distribution phase forming at higher ranges.
Bitcoin Dominance and Altcoin Prospects
Analyst Seth noted a descending triangle stretching back to 2017, indicating consistent lower highs. Historical rejections in 2017–2018 and 2021 led to steep drops in dominance, both times below 40%.

In mid 2025, dominance peaked near 65% before rejection at the descending trendline, now retracing to 57.96%. Moving averages recently formed a bearish crossover, supporting weakening momentum. If dominance continues to fall toward 40–42%, capital rotation into altcoins may intensify.
This aligns with analyst perspectives suggesting altcoins could gain strength during Bitcoin’s corrective stages. Unless dominance breaks decisively above the long term descending trendline, the structural bias points to extended weakness favoring alternative assets.