

- Coinbase stock broke a major trendline and retested it, confirming strong upward momentum.
- Rising volume during consolidation shows strong investor interest and confidence in future growth.
- Technical patterns like the cup-and-handle suggest Coinbase may continue to rise significantly.
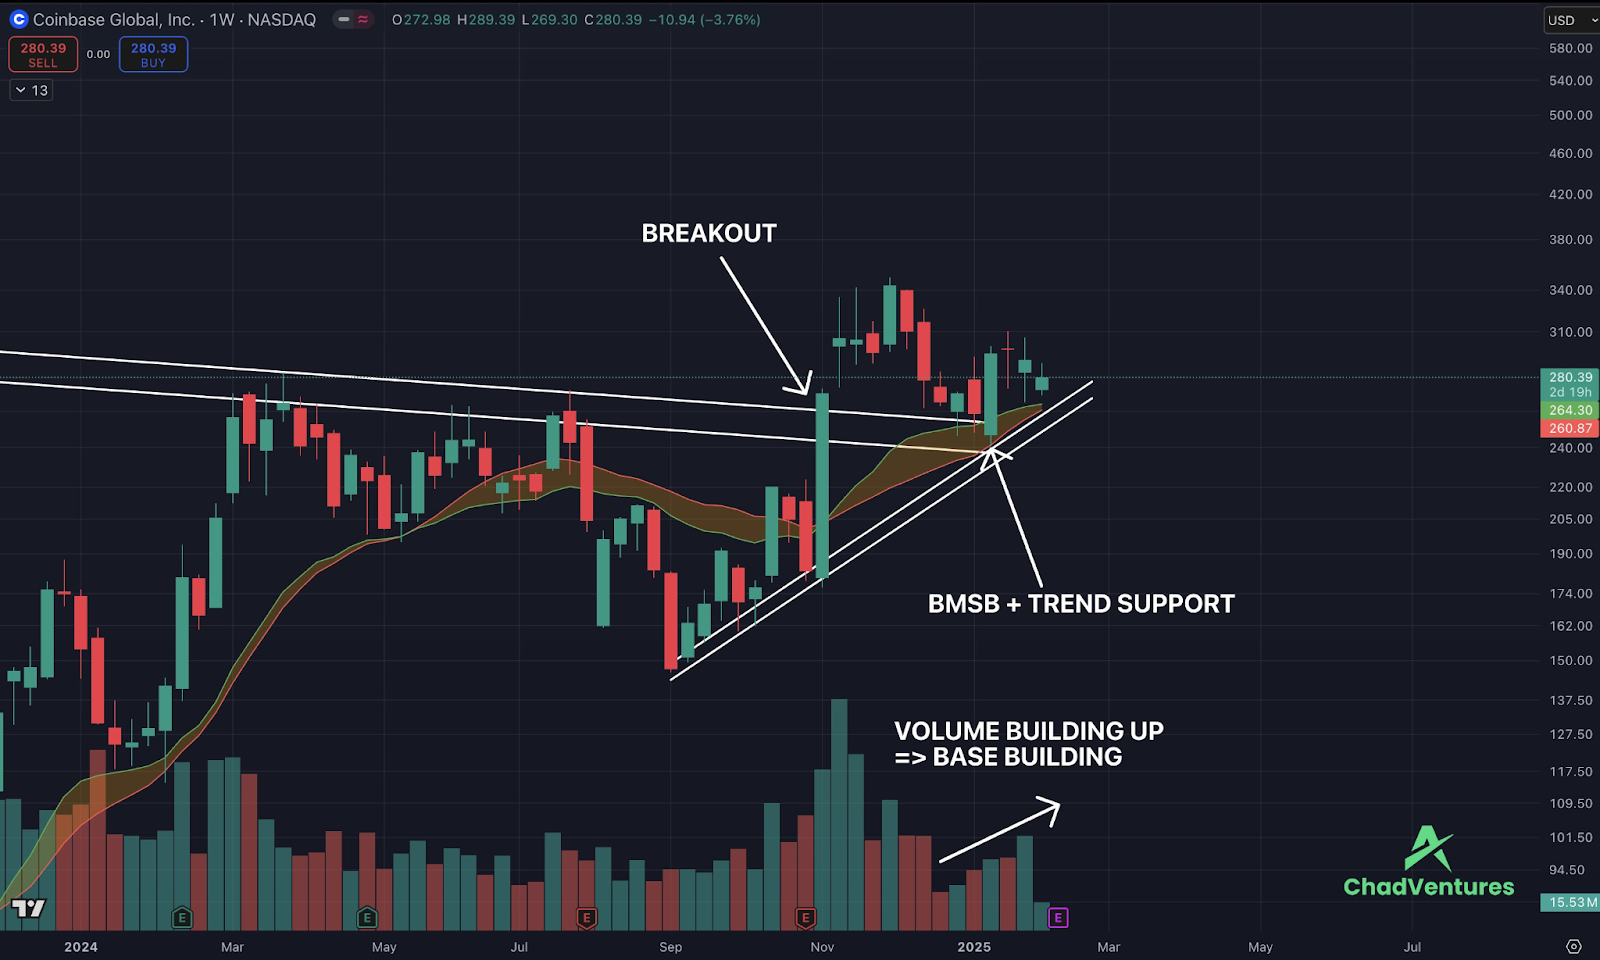
Coinbase Global Inc. (COIN) is exhibiting strong bullish momentum on its weekly chart, attracting significant attention from market analysts. The stock’s technical breakout from a crucial trendline, established in April 2021, occurred in November 2024, marking a critical shift in its trajectory.
Source: ChadVentures
Following this breakout, COIN entered a consolidation phase that saw it successfully retest the breakout zone, reinforcing the validity of the move. The stock has since stayed above critical support levels, including the Bull Market Support Band (BMSB) and the upper and lower trendlines, a testament to its growing strength. Analyst Chad Ventures describes the setup as “very good,” highlighting its potential for further upside.
The Technical Breakout That Changed the Game
The breakout from the April 2021 trendline was more than a simple technical event; it set the stage for a series of bullish developments. COIN’s ability to stay above the BMSB demonstrates strong market confidence, as this support band has historically acted as a springboard during uptrends.
The alignment of the BMSB with the trend support line further reinforces this zone as a safety net for investors. This dual layer of support adds weight to the bullish case and positions COIN as a stock with a solid foundation.
Volume Dynamics: The Signal of Accumulation
Adding to the optimism is the increasing volume observed during the consolidation phase. Volume dynamics often act as a critical barometer of market sentiment, and in COIN’s case, the rising volume indicates robust accumulation.
This base-building process, marked by steady volume increases, suggests that investors are preparing for a potential breakout. The technical structure further supports this narrative, with the formation of a classic cup-and-handle pattern—a reliable indicator of an impending upward move. This pattern underscores the stock’s bullish potential, provided it can maintain its support levels.
A Robust Technical Structure and Analyst’s Confidence
The chart’s technical structure combines several bullish elements that paint an optimistic outlook. The successful retest of the breakout zone, coupled with the ongoing uptrend, is a textbook example of strong technical performance. The ascending trendline, which has consistently guided the stock upward, aligns seamlessly with the BMSB to create a robust support framework.
This confluence of factors makes COIN’s setup exceptionally appealing to market participants. Chad Ventures, known for his keen technical insights, emphasized, “Because of the successful breakout retest and the ongoing uptrend, this chart is looking very good in my opinion.” His confidence in COIN’s potential adds credibility to the bullish narrative.
Short-Term Fluctuations Don’t Detract from Long-Term Potential
Currently trading at $280.39, down 3.76% for the day, COIN’s short-term fluctuations do not detract from its overall bullish structure. The stock’s ability to hold above key levels while forming a strong technical base suggests that it is primed for further gains. With the cup-and-handle pattern nearing completion, the potential for a breakout looms large. Ventures’ analysis points to a bright future for COIN, although he reminds investors that this is not financial advice.