- LINK returns to a long-standing $11 support that shaped major reactions across multiple cycles.
- Weekly structure shows lower highs while price presses into a zone that held firm since mid-2024.
- Long-term triangle pattern narrows toward 2026 as LINK interacts repeatedly with rising support.
Chainlink trades near a major weekly support close to eleven dollars, a level that has held steady since mid-2024. Market watchers monitor this zone because past reactions at the same level often shaped later movements on higher timeframes. The structure now sits at a point where patience matters, as zones like this often decide the next major trend.
LINK Approaches a Key Weekly Level After a Multi-Month Decline
Chainlink has moved downward for several weeks and now approaches a long-term horizontal level that appears repeatedly on the weekly chart, according to analysis prepared by Crypto Pulse. Price forms lower highs during recent candles, and the current move presses toward the $11–$12 area. Earlier cycles show steady upward moves forming after contact with this same level.
Crypto Pulse notes that the latest weekly candle still holds above the marked support while downward momentum remains present. The chart does not show volume data, so the focus remains on pure structure. Chainlink trades at 12.46% with a 4.5% daily gain during the displayed period.
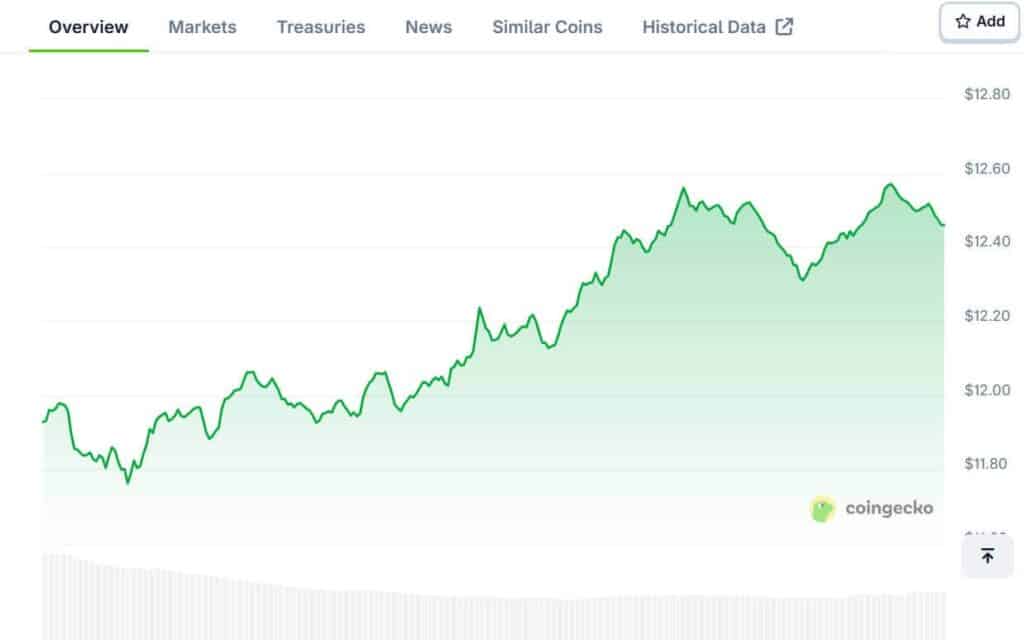
Coingecko data shows a 24-hour range between $11.76 and $12.57 as buyers maintain control near the upper side of the window. Market cap stands at $8.70 billion, and the fully diluted valuation records $12.49 billion. The current intraday curve forms a steady upward sequence with several peaks near $12.60 before easing slightly.
Long-Term Compression Pattern and Ongoing Market Activity
According to an observation by World of Charts, Chainlink trades inside a long symmetrical triangle with rising support and falling resistance. Price repeatedly interacts with an ascending trendline near the $11–$12 zone.
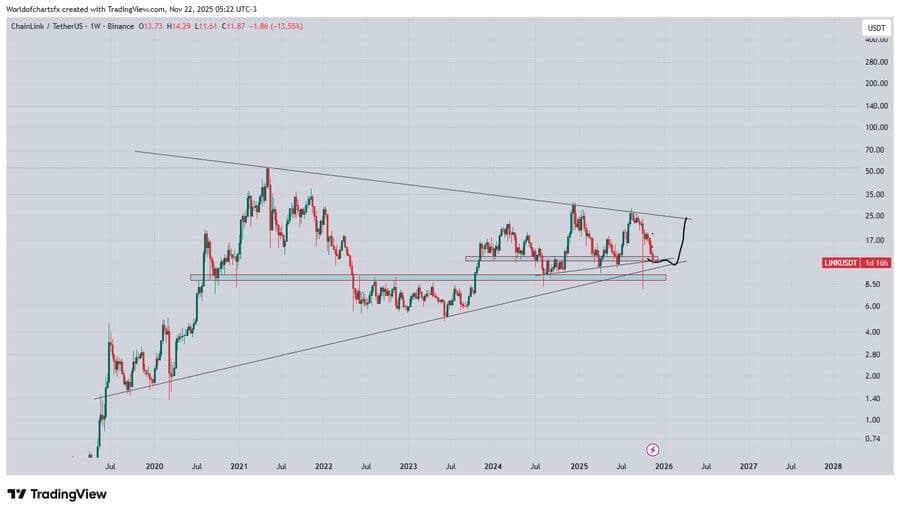
Higher lows appear along this support since 2020, while lower highs continue from the 2021 peak. Recent candles show a drift toward this long-standing level as the wedge narrows into 2026.
Analysts monitor the support closely because this area remains one of the most consistent reaction points across multiple market cycles. If buyers defend the zone again, the structure may form a fresh upward move. If not, observers wait for the next clean setup as the weekly candle closes.