
- Chainlink broke above $21 after years of consolidation, with Fibonacci targets pointing to $31.57, $53, $69, and $145.
- Analyst Lark Davis noted two bull pennants, each aligning with MACD golden crosses, supporting bullish continuation signals.
- Analysts stressed that stability above $25–$27 is crucial to sustain momentum and test higher resistance near $30 and beyond.
Chainlink has surged above long term resistance levels, with analysts pointing to technical structures that could lead to higher gains. The asset is trading at $24.78, a 1.5% decline, after moving beyond a symmetrical triangle pattern that had been in place since 2022. This breakout, according to analyst Ali, indicates a change from prolonged consolidation into a potential expansion phase that could define price action in the coming year.
Multi Year Resistance Cleared
From 2022 to mid 2023, LINK traded below $10, forming a structural base with gradual higher lows. A tightening wedge emerged as rising trendline support converged with descending resistance from previous highs.
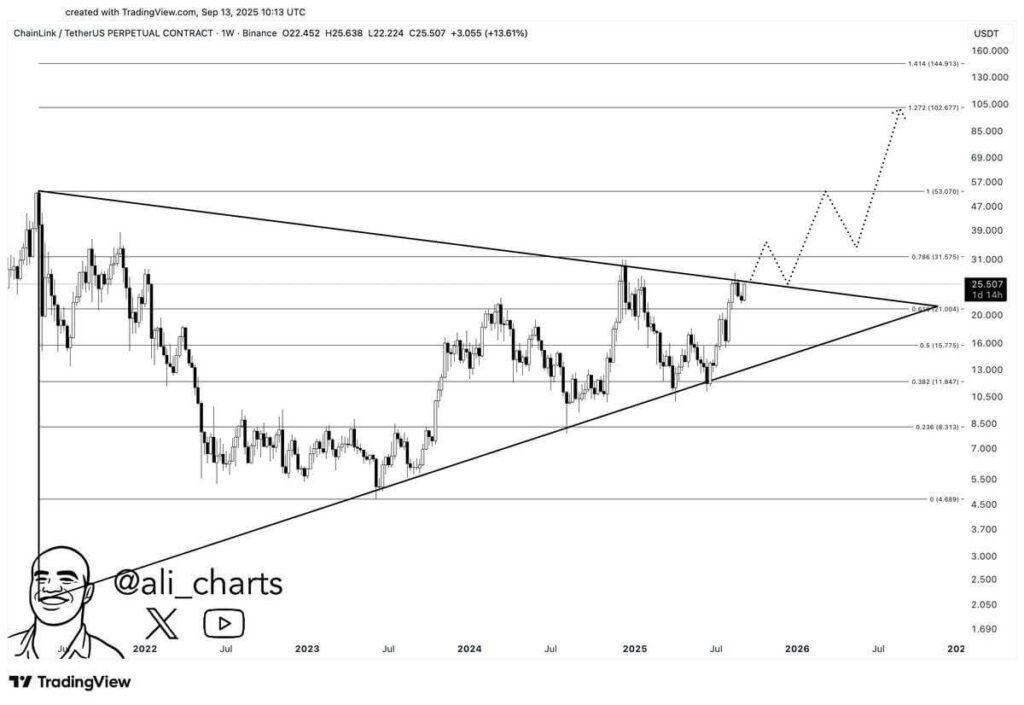
The decisive breakout above $21 marked the first clear move beyond that resistance in years. Technical levels now provide milestones for the trend. Immediate resistance is set near $31.57, aligning with the 0.786 Fibonacci retracement.
Sustained strength could lead toward $53 and $69, with the 1.272 extension projecting further at $102.6. A blow-off target remains higher at $145, based on the 1.414 extension. On the downside, $21 serves as a crucial support zone, followed by $15.77 and $11.84 if a retest occurs.
Recurring Bull Pennant Adds Momentum Confirmation
A different setup was highlighted by analyst Lark Davis, who noted LINK forming consecutive bull pennants supported by momentum indicators. In early August, the first pennant breakout combined with a MACD golden cross, fueling a rally of over 54%.
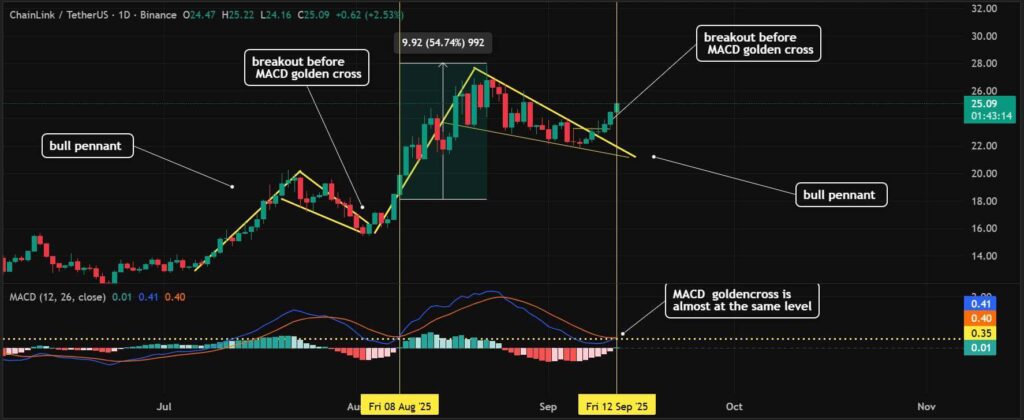
Price jumped from $18.12 to $27.94 in that phase. The second pennant appeared in late August through September, breaking out near $24.50–$25.00. At the same time, the MACD line at 0.41 crossed above the signal line at 0.40.
This synchronization between pattern resolution and momentum indicator confirmed a strong continuation signal. Resistance stands ahead at $27.94 and the psychological $30 mark, while support rests near $22 at the pennant base.
Structural and Short Term Patterns Align
Both Ali and Davis identify conditions that could favor continued bullish momentum, though their focus lies on different aspects of the setup. Ali emphasized the long-term breakout from consolidation supported by Fibonacci projections. Meanwhile, Davis tracked shorter-term continuation patterns aligned with the MACD golden cross.
The alignment of structural breakout and recurring pennant patterns highlights significant interest from both institutional and retail participants. Immediate price stability above $25–$27 remains key to maintaining the trajectory toward higher resistance zones.