
- Chainlink trades at $27.60 after a 17.11% surge, breaking above $23.00 to exit a multi year symmetrical triangle.
- $30.00 stands as immediate resistance, with possible upside toward $35–40, while $23 is a key retest level.
- Analysts note short term bullish patterns, with LINKBTC recovering from oversold conditions, supporting further upward momentum.
Chainlink has entered a decisive phase after years of compression, breaking through a multi-year consolidation structure and reclaiming critical technical levels. The asset is now trading around $27.60, a strong 17.11% daily gain.

The breakout above $23.00 confirms the completion of a symmetrical triangle pattern that has held since 2021. This move shows a potential change from prolonged accumulation toward a more expansive bullish cycle, with several key Fibonacci levels now supporting the move ahead.
Key Fibonacci Zones
Chainlink has reclaimed the 0.618 Fibonacci retracement level at $21.60, supporting the prevailing bullish outlook. The next resistance is near the 0.786 Fibonacci level at $31.87.
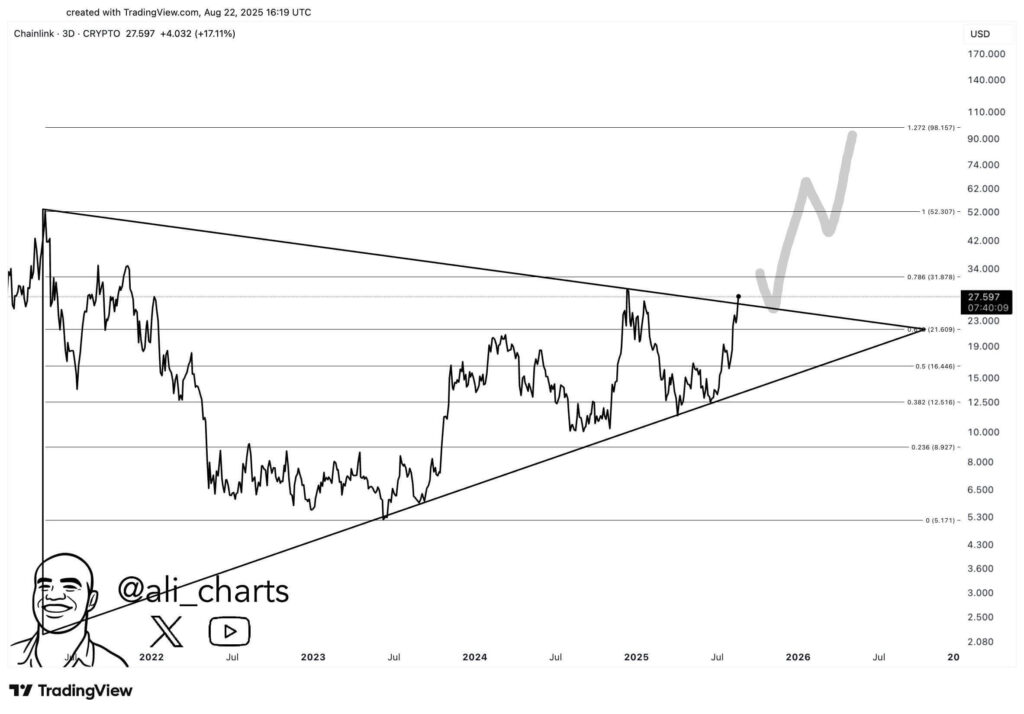
A sustained move beyond this level could lead to $52.30, which aligns with the 1.0 Fibonacci target. If momentum remains strong, the 1.272 extension at $98.15 emerges as a longer term objective.
However, multiple supports remain in focus if prices retrace. Immediate lower levels include $16.44 at the 0.5 retracement and $12.51 at the 0.382 level. These supports, if tested, would provide critical confirmation zones for ongoing trend strength.
Key Levels Around $30
Recent technical analysis shows that $30.00 is the immediate barrier for buyers. A break above this level may accelerate upside movement toward $35–40. On the other hand, rejection at this level could lead to a retest of the breakout area around $23.00.
Such a pullback would not necessarily end the structure but instead serve as a check of breakout validity. Additional supports have been outlined across historical levels.
These include $20.00, which was a prior consolidation base, as well as $16.00, $12.50, $9.50, $7.30, and $5.00. Market observers note that holding above $23.00–$25.00 keeps the breakout intact, while failure to hold may expose these deeper levels.
Short Term Formations
According to CRYPTOWZRD, Chainlink recently closed with strong bullish momentum, supported by LINKBTC moving upward from an extreme oversold condition.
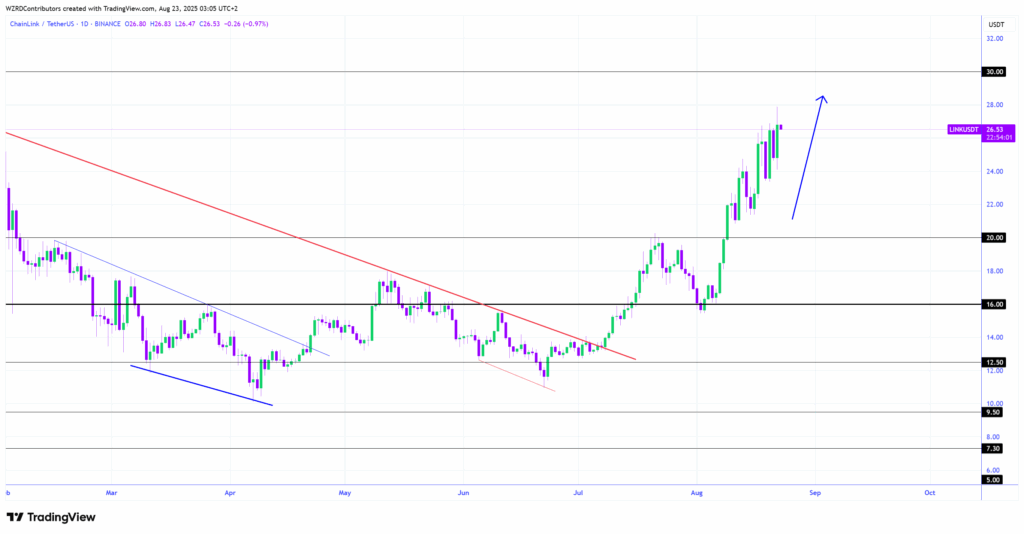
The analysis highlighted short term structures on lower time frames as opportunities for near-term moves. Meanwhile, the larger breakout structure continues to suggest buyers remain in control despite the sharp vertical price rise.
The overall setup shows a transition from long term consolidation to expansion. If Chainlink maintains support above $23.00, the probability of higher cycle targets between $30 and $52 is high.