
- LINK fell from $13.77 to around $11.77 after a 95% rally, with $11.50-$11.60 now serving as immediate support.
- Transactions above $1M dropped from about 59 to 10, while 1.75M LINK moved onto exchanges, signaling potential selling.
- RSI remains below 50 and MACD is bearish, though the positive histogram suggests short-term momentum may be improving.
Chainlink faces renewed selling after a 95% rally from nearly $7 to $13.77, according to analyst Ali Charts. The analyst cited a weekly TD Sequential sell signal, weaker whale activity and 1.75 million LINK deposited to exchanges. LINK now trades near $11.77, below $12, after the September 7 peak triggered a correction.
LINK Rally Runs Into Selling Pressure
Ali Charts said large transactions above $1 million fell from about 59 over two weeks to roughly 10. The decline points to lower activity among major holders as LINK retreats from its recent high.
Exchange balances also increased during the move lower. Holdings rose from 269.25 million to about 271 million LINK after 1.75 million tokens entered trading platforms. However, the analyst said these deposits may indicate that some holders are preparing to sell.
LINK Drops Below Key $12 Level
LINK climbed from about $11.60 to above $13.50 between September 5 and 7. Sellers rejected prices around $13.50 to $13.70. Since then, LINK has formed lower highs and lower lows. The token fell below $12, leaving $11.50 to $11.60 as immediate support.
A break below that area could expose $11 to $11.20. However, a move back above $12 would place $12.50 to $12.70 among the next resistance levels. LINK currently trades at $11.772 after opening at $11.783 and reaching $11.800.
Momentum Shows Early Signs of Recovery
Momentum remains below neutral levels. RSI is at 36.47, while its moving average is at 32.71. Notably, RSI has recovered from near 30 but remains below the neutral 50 level. The MACD also remains bearish, with its line at -0.134 against a signal line at -0.158.
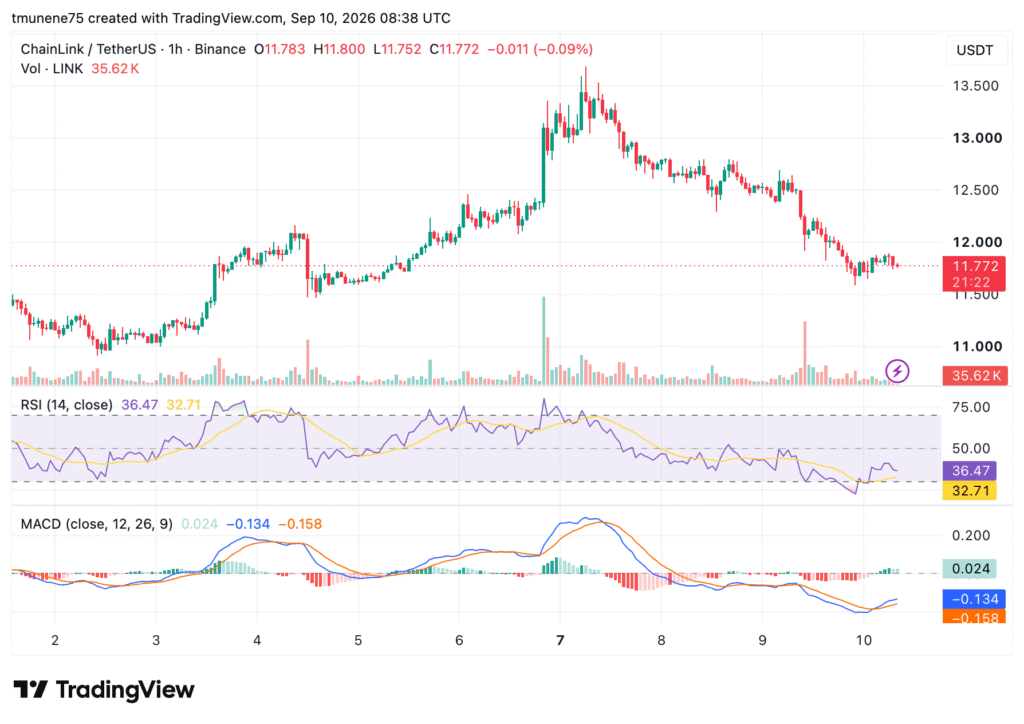
However, the MACD histogram is near 0.024, showing improving short-term momentum. Ali Charts identified the weekly TD Sequential sell signal after LINK’s 95% advance. The indicator adds to the whale activity decline and higher exchange balances cited by the analyst.