- Cardano defends the $0.62 support, forming a year-long triangle pattern nearing breakout.
- Reduced leverage and stable volume indicate a cautious yet steady market setup for ADA.
- If $0.62 holds, Fibonacci targets between $0.95 and $1.90 remain in play for Cardano.
Cardano (ADA) is trading slightly above a key support level near $0.62, a price area considered crucial for sustaining bullish momentum. Market analysts observe that this level aligns with the 0.5 Fibonacci retracement zone, forming the base of a long-term symmetrical triangle that has been developing since early 2025.
Cardano Trades Near Support as Triangle Pattern Tightens
According to analysis prepared by Ali Charts, $0.62 must hold as support for Cardano “to have a real shot at breaking out toward $1.90.” The price is currently around $0.64 and continues to move within converging trendlines that define the symmetrical triangle.
These patterns often appear before large price movements, and the current setup has been compressing for nearly a year. Fibonacci levels indicate potential upside targets near $0.95, $1.28, and $1.86 if the structure remains intact.
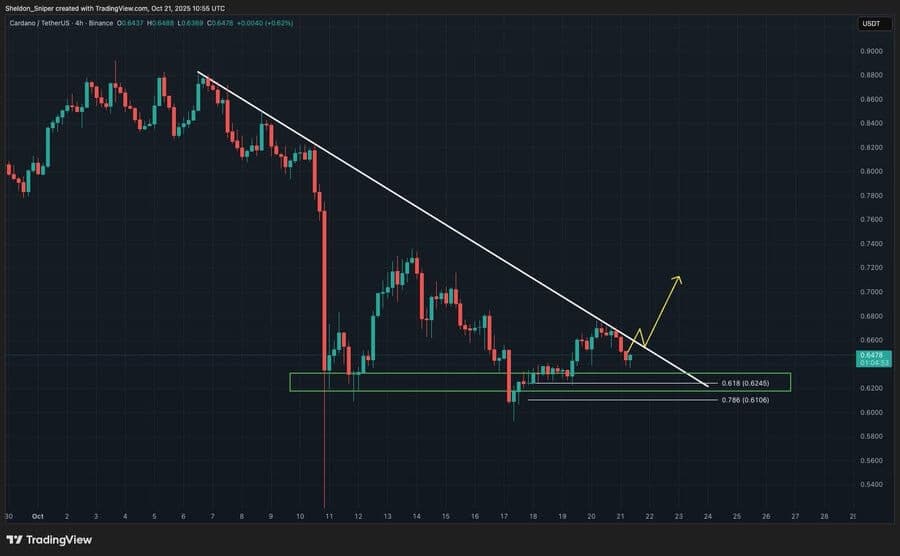
The chart shows that Cardano has rebounded several times from the $0.61–$0.62 zone, with consistent buying pressure supporting this base. According to an observation by Sheldon The Sniper, ADA is also testing a descending trendline that has been active since early October. He noted that the asset is “looking strong and close to the momentum trend.”
Market Structure, Open Interest, and Technical Indicators
Cardano trades inside a support zone between $0.6245 and $0.6106. Price action shows higher lows, signaling steady demand and controlled market conditions. A confirmed move above the descending trendline may position ADA for a short-term uptrend toward the $0.70 level before testing higher Fibonacci zones.
Data from Coinglass shows ADA’s futures open interest at $648.56 million, down from $1.8 billion in mid-September. This drop indicates reduced leverage and a more cautious trading stance. Lower open interest paired with price stability has often preceded larger movements in past market cycles.
Technical readings reflect easing bearish pressure. The MACD line remains slightly below the signal line, while the narrowing gap indicates weakening selling activity. The RSI stands near 40, showing the market is stabilizing. Should $0.62 hold as it is, then Cardano can possibly accumulate to a potential breakout period of $0.95 and $1.90.