
- Bullish divergence & a falling wedge hint at a potential EGLD reversal, with weakening selling pressure & rising momentum.
- MACD crossover & green histogram reinforce bullish sentiment, signaling a possible trend shift if resistance levels break.
- Key support at $20 holds firm, while resistance at $28 & $32 must be cleared for EGLD to confirm an uptrend.
The price action of EGLD on the 12-hour chart on Binance shows a major technical setup. The formation of a falling wedge means that trend reversals are possible. The cryptocurrency has been in a long-term downward trend, having dropped to around $22, with a slight recovery. Now a bullish divergence is on the scene, suggesting momentum may shift.
Key Technical Patterns and Indicators
A falling wedge pattern appears on the EGLD/USDT chart, characterized by lower highs and lower lows. This setup historically signals a breakout to the upside. Besides, a bullish divergence between price action and the MACD indicator has strengthened reversal expectations. While EGLD’s price makes lower lows, the MACD histogram and signal lines form higher lows. Hence, this divergence indicates weakening selling pressure and rising bullish momentum.
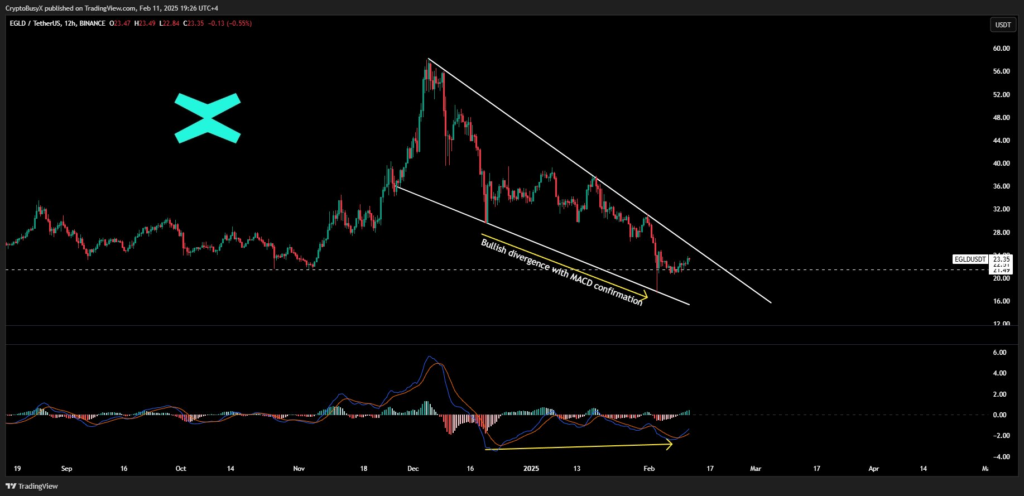
The MACD crossover further confirms a potential trend change. The histogram has turned positive, revealing increasing buying interest. Moreover, the MACD lines have crossed upwards, which often precedes a rally. The histogram turning green reflects strengthening market sentiment.
Crucial Support and Resistance Levels
A horizontal support level near $20 has consistently acted as a price floor. EGLD recently rebounded from this level, reinforcing its significance. Additionally, the upper descending trendline serves as a key resistance zone. Previous attempts to break this resistance have failed, pushing the price lower each time.
Currently, EGLD trades at $23.35, reflecting minor gains from recent lows. If buyers maintain momentum, the next resistance targets stand at $28 and $32. However, failure to break above the descending wedge could lead to further consolidation or renewed bearish pressure. A drop below $20 would invalidate the bullish setup, exposing EGLD to further downside risks.
Market Sentiment and Outlook
The presence of a falling wedge increases the likelihood of trend exhaustion. Additionally, the large “X” symbol on the chart suggests a bearish outlook invalidation. If EGLD follows technical indications, a bullish reversal could materialize.
According to analyst CryptoBusy, EGLD’s current price action lags behind its underlying development. Consequently, investors remain watchful for a breakout confirmation. A decisive move above resistance with strong volume would confirm trend reversal, setting EGLD for a sustained uptrend.