

- Bitcoin loses approximately 108,700 non-empty wallets since October 16, according to Santiment Intelligence.
- Darkfost identifies $74,600 as key Fibonacci support, with a potential decline toward $71,000 if the level fails.
- BTC trades near $74,783 as RSI remains below 50, with immediate support at $74,000 and resistance at $76,000.
Bitcoin has lost nearly 109,000 non-empty wallets since October 16, when the total reached 59.99 million, according to Santiment Intelligence. The decline comes as BTC trades below $75,000, while analyst Darkfost tracks a Fibonacci retracement near $74,600. Both reports focus on retail withdrawals and Bitcoin’s nearby support levels during the latest market decline.
Wallet Count Drops as Smaller Holders Exit
Santiment said the network’s non-empty wallet count has fallen by approximately 108,700 since October 16. Smaller holders may be consolidating funds or emptying wallets during the decline. However, a lower wallet count does not automatically mean Bitcoin’s utility is shrinking.
Santiment said the trend could take on a different meaning if BTC holds between $74,000 and $75,000 as wallet numbers fall. Exchange supply has also declined to about 1.28 million BTC. The firm highlighted a recovery above $78,000 to $80,000 alongside continued wallet losses.
Darkfost Tracks Fibonacci and Moving Averages
Meanwhile, Darkfost said Bitcoin’s second wave entered a retracement zone near $74,600. That level represents the 0.382 Fibonacci retracement, although the decline could extend toward $71,000. The RSI was approaching 30, and Bitcoin had lost its 200-day moving average.
Bitcoin was approaching its fourth consecutive daily close below that average. Darkfost also noted that the 200-week moving average was nearing $70,000. That level converges with the 0.5 retracement. Darkfost said a move below this zone would create a weaker structure.
BTC Holds Near $74,800 After Latest Rebound
The four-hour BTC/USD chart shows a decline from roughly $85,000 in early October to $74,782.82 on November 10. A recovery toward $80,800 around November 5 failed, and BTC later fell below $76,000.
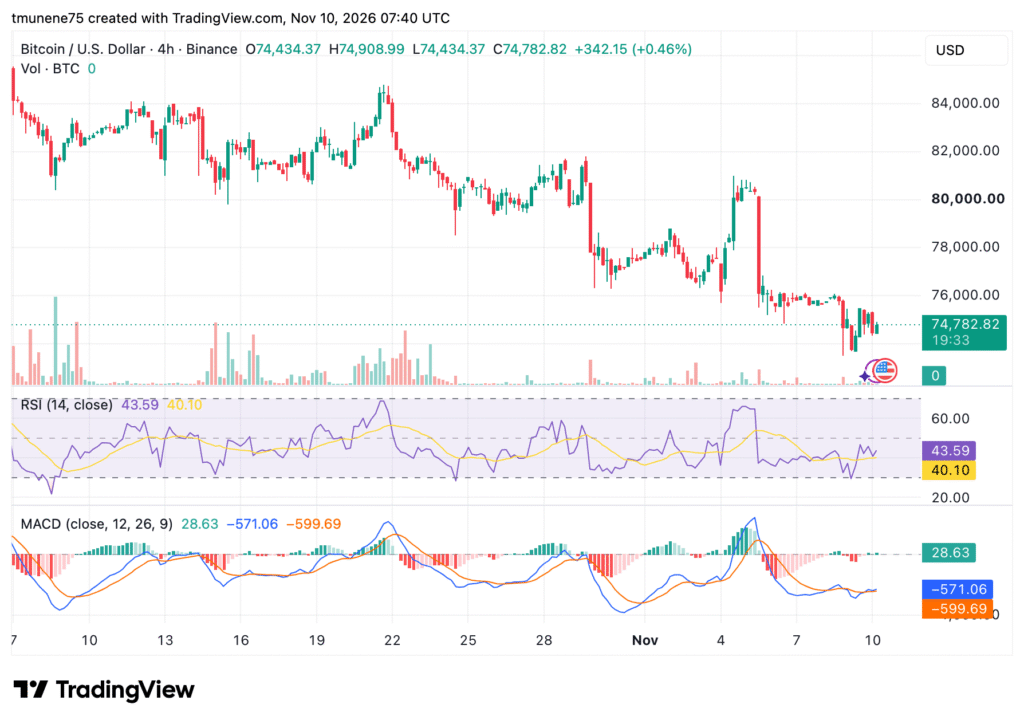
The latest candle opened at $74,434.37, reached $74,908.99, and closed at $74,782.82. It gained $342.15, or 0.46%, while displayed volume remained at zero BTC. The chart’s RSI stood at 43.59, above its 40.10 moving average but below the neutral 50 mark.
The MACD histogram was positive at 28.63. The MACD line at -571.06 was above the signal line at -599.69, although both remained negative. Immediate support is at $74,000, followed by $72,000. Resistance is at $76,000, then $78,000 and $80,000.