
- BONK nears key support at $0.000009 amid a strong downtrend, forming lower highs and lows since January 2025.
- The three-day chart shows BONK holding its structure within a parallel channel, with potential for a rebound if key support holds.
- Moving averages and indicators suggest bearish continuation, with resistance at $0.00001566 and weak buying pressure limiting recovery.
Bonk (BONK) is heading towards the $0.000009 target after breaking out of a parallel channel. Analyst Ali indicates its recent price action, with a 0.70% price increase to $0.000013495. The price remains in a firm downtrend. It has been making lower highs and lower lows since mid-January 2025. The price previously peaked above $0.00003100 before experiencing sustained declines. Moving averages indicate continued bearish sentiment, keeping investors cautious.
BONK Maintains Structure Despite Recent Declines
The three-day chart shows BONK moving within a structured parallel channel. The price surged in late 2023 before experiencing a pullback in early 2024. However, it remained within the channel’s boundaries, confirming its structured movement.
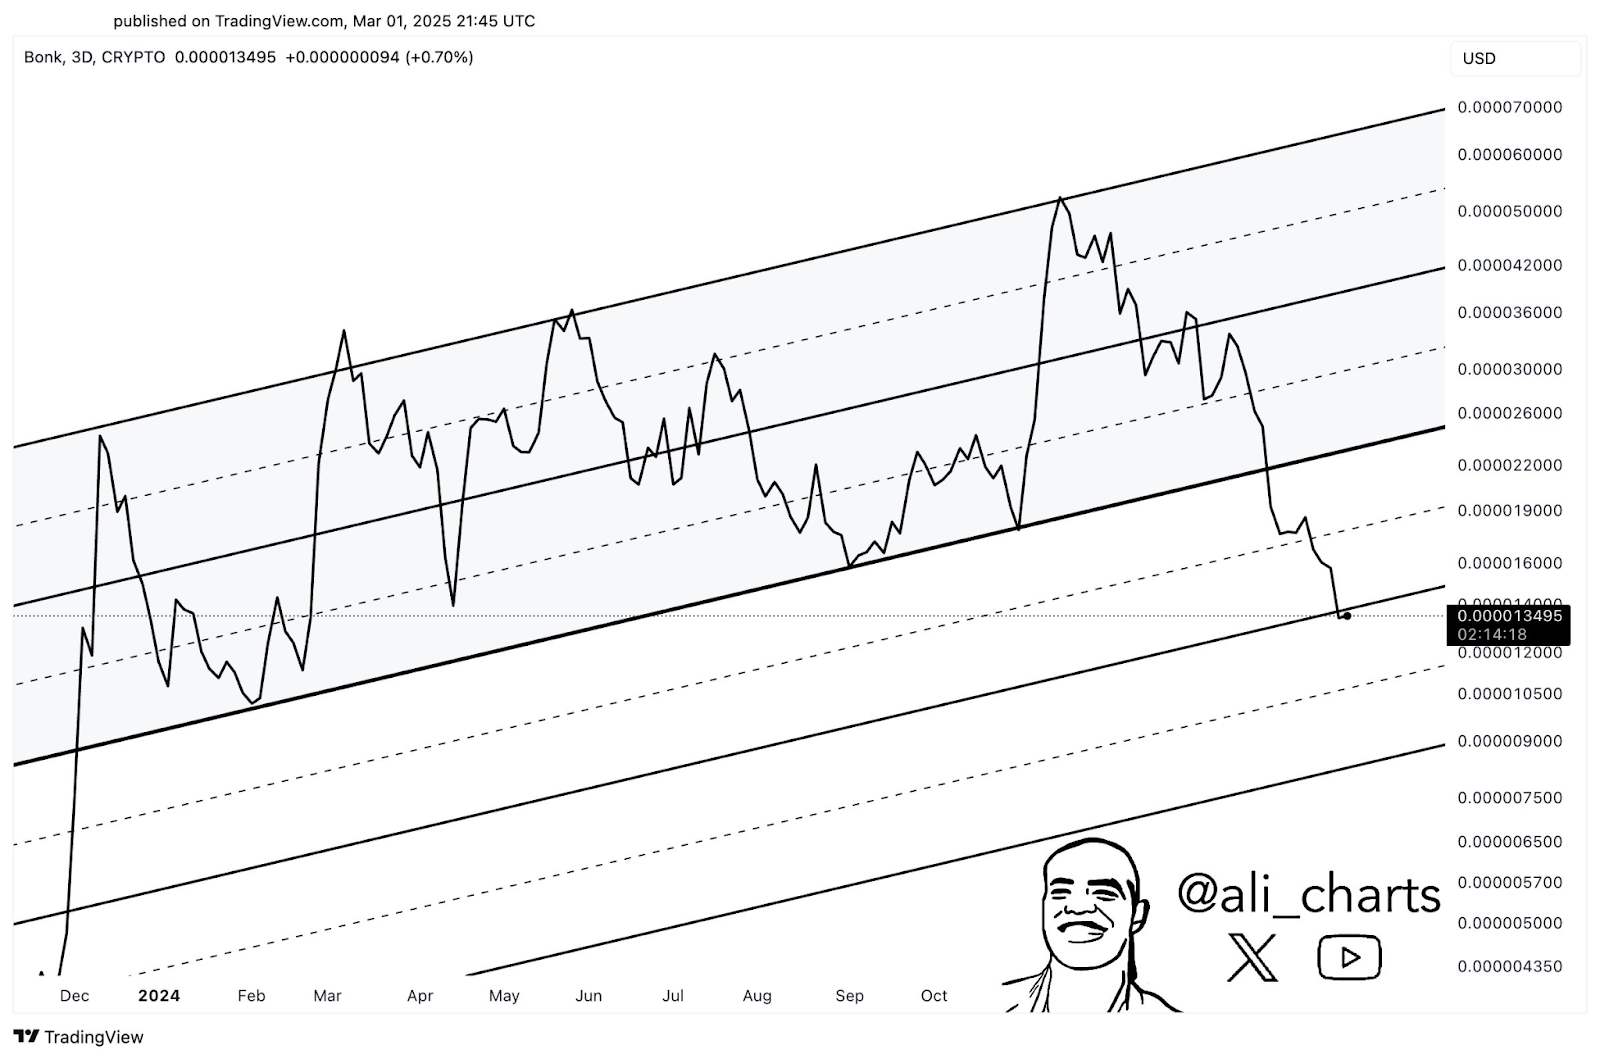
By mid-2024, BONK entered a consolidation phase, fluctuating around the channel’s midline. A breakout above this level could indicate renewed bullish momentum. Conversely, staying below may reinforce the current bearish trend.
Recently, BONK tested the lower boundary of the ascending channel. If this support holds, a potential rebound may follow. However, a break below could signal further downward pressure. Trend lines provide key support and resistance levels, confirming the market’s structural integrity. Despite recent declines, BONK has respected major trend lines.
Moving Averages and Indicators Suggest Bearish Continuation
On the daily chart, BONK’s price action aligns with a strong bearish trend. The short-term blue moving average has consistently rejected price recovery attempts. The red and orange moving averages reinforce broader bearish trends. Resistance is visible at $0.00001566, $0.00002029, and $0.00002538, levels where past price action has reacted.
The stochastic RSI indicator currently sits at 47.31 and 34.08. It has previously cycled between overbought and oversold conditions. A slight upward movement suggests a minor price recovery attempt. However, weak buying pressure and small-bodied candlesticks indicate uncertainty.
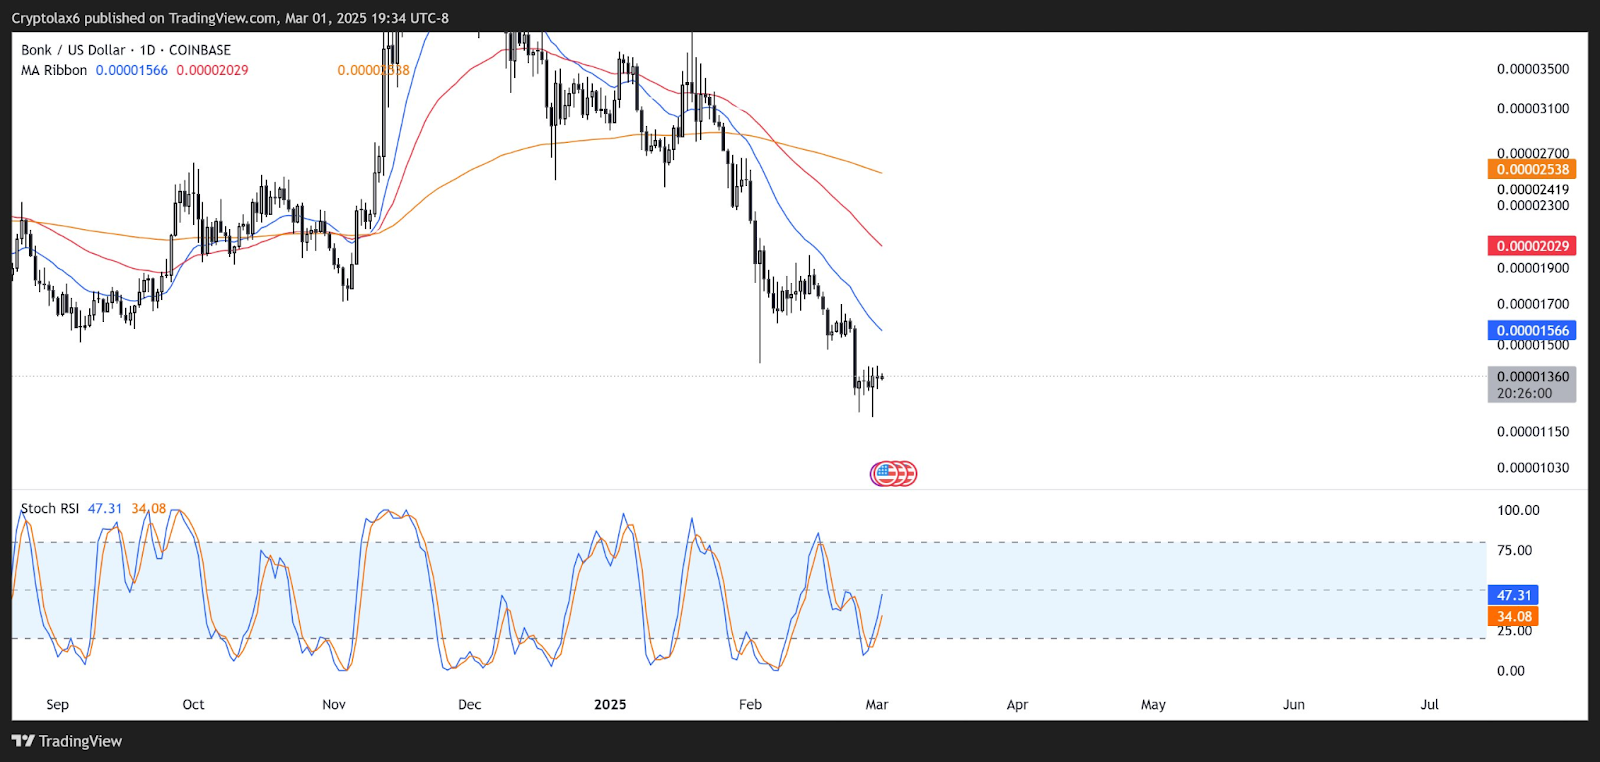
Market sentiment and broader conditions will determine BONK’s next move. The price remains below key moving averages, reinforcing bearish dominance. Trading volume is not displayed, limiting confirmation of market activity. If support holds, a short-term rebound is possible. However, breaking lower could extend declines.