- BNB’s surge past $1,000 shows renewed bullish momentum with Fibonacci projections hinting at exponential gains this market cycle.
- Strong volume confirms BNB’s breakout above key resistance, reinforcing the potential for Patel’s $2,000 and $5,000 targets.
- Historical cycles and ascending patterns support BNB’s rally, with long-term charts pointing toward sustained institutional confidence.
Binance Coin (BNB) has broken past the $1,000, trading at $1,023.98 after gaining $97.47 in a single session. This sharp 10.52% rally highlights the token’s strongest momentum since its 2021 peak, driving speculation about whether Patel’s bold $2,000 and $5,000 targets could be achieved in the current cycle.
Crypto Patel captured the sentiment in his post on X, noting, “$BNB is only 100% away from my $2000 target… And just 400% away from my $5000 target.” His remarks reflect rising confidence as BNB shows sustained strength above critical resistance.
Cycles and Technical Structure
BNB’s chart illustrates a consistent bullish pattern. The chart begins with 2018 and 2020 where prices consolidated between $1.90 and $36. However, the 2021 breakout changed dynamics, pushing BNB to highs near $690.
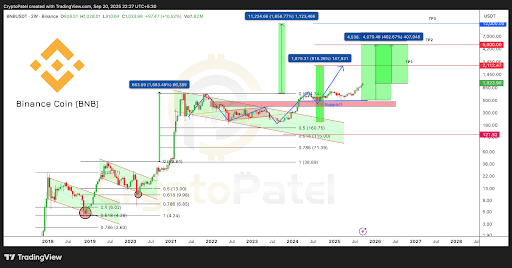
The 2022–2023 correction pulled the token back to $160–$180. This 18-month base built resilience for the current cycle. Consequently, BNB’s decisive breakout above $663.89 marks 1,683% gains from cycle lows. Additionally, Fibonacci retracement levels highlight the $160.75 zone as a crucial support that enabled this turnaround.
Targets and Projections Ahead
Fibonacci extensions outline bold upside projections. The first target, $1,879.31, suggests gains of 918% from earlier benchmarks. Moreover, higher targets include $4,070.48 and an extreme projection of $11,234.66, indicating a potential 1,658% upside.
Besides projections, technical patterns show BNB moving in a multi-year ascending channel with higher lows and higher highs. Support remains firm around $500–$600, a zone where prior resistance turned into strong backing. Additionally, the pink shaded region on charts signals critical defense for the current uptrend.
Volume shows participation surged during BNB’s breakout above $663.89, confirming that buyers are validating the move with conviction.
BNB’s breakout above $1,000 validates long-term bullish patterns, with Fibonacci targets suggesting room for exponential upside in the ongoing cycle.