
- BNB faces resistance at $660, with barriers from MA levels, Fibonacci, and TD Sequential, making it a pivotal breakout zone.
- A breakout above $660 could push BNB toward $680-$700, while rejection may lead to a retest of $600, or even $570-$550.
- Trading volume spikes during dips indicate strong buying interest, suggesting accumulation at lower price levels around $600.
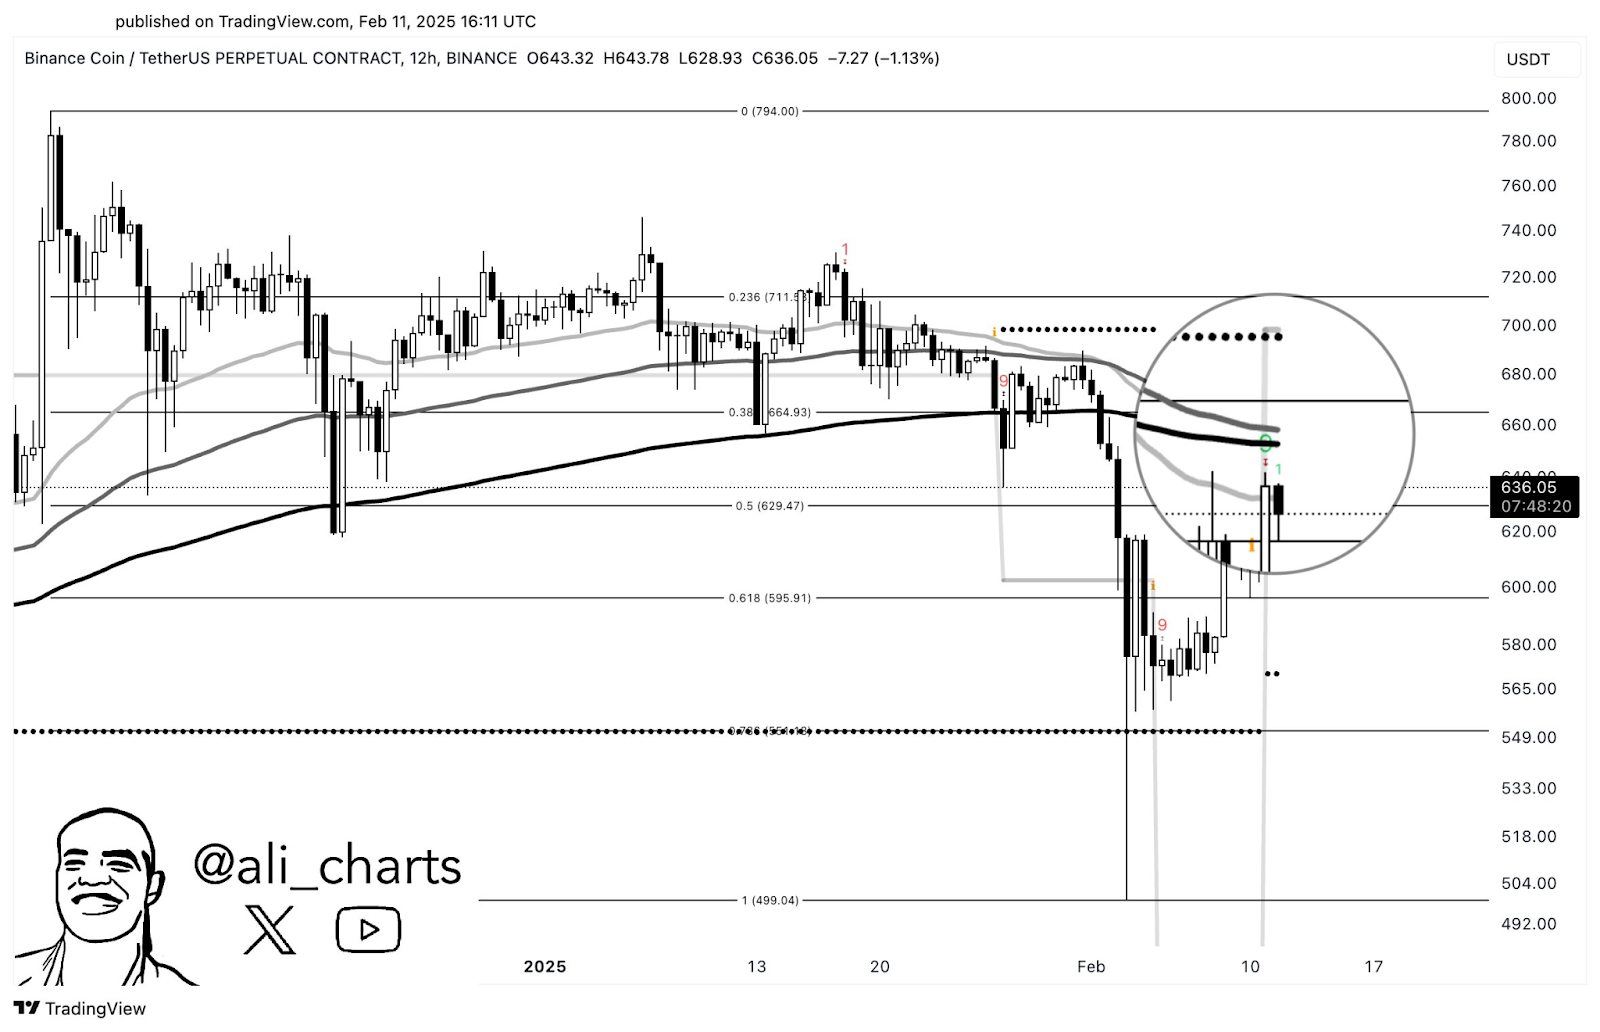
Binance Coin (BNB) is nearing a crucial resistance zone, with technical indicators creating strong barriers. According to analyst Ali, the asset is seeing resistance at several levels, including the 200, 100, and 50 day moving averages.

The 0.382 Fibonacci retracement level, TD Sequential’s resistance trendline, and TD Sequential’s risk line are all contributing to selling pressure. Breaking through these levels could determine BNB’s next price movement.
BNB Faces Resistance
BNB has had sharp volatility, suggesting an effort to recover from a previous decline. A strong bounce from the 0.618 Fibonacci retracement level at $595.91 hinted at a potential retracement toward higher levels. The 0.50 Fibonacci level at $629.47 has acted as a crucial point.
 Source: Ali
The 200 period moving average is also a barrier, at $664. Short term resistance is around $650-$660, where lighter moving averages are forming barriers. The price is struggling in this range, showing a pull between buyers and sellers.
Technical Indicators Show Resistance at $660
BNB’s price patterns has seen substantial swings, recovering from lows of around $555-$560. A prior sharp decline pushed the asset downward before buyers stepped in to defend lower price levels. Now, the price is attempting to stabilize near $643.
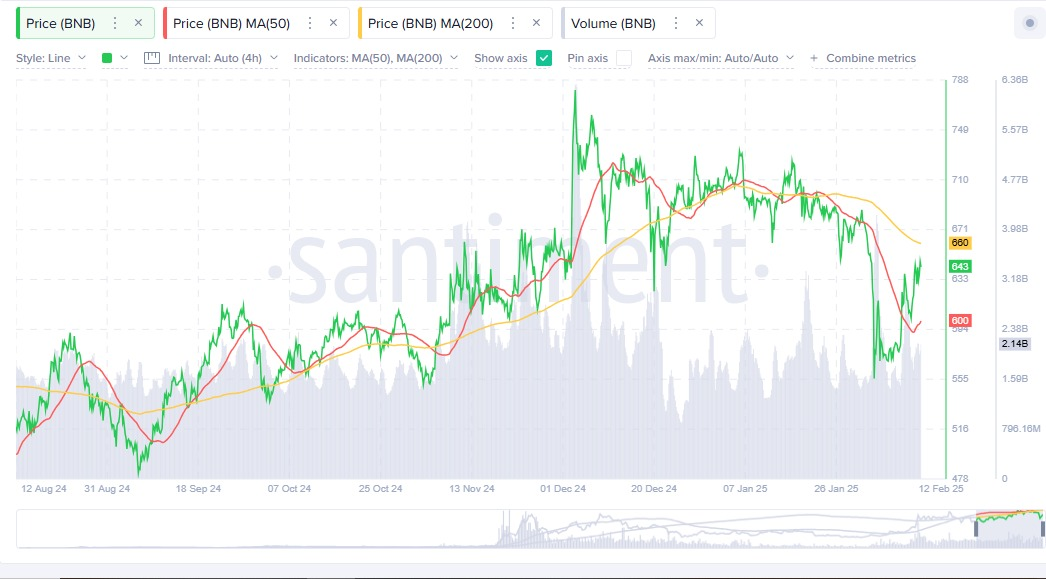
Source: Santiment
The 50 day moving average is at $600, and the price has reclaimed this level. This movement suggests a potential trend shift. However, the 200 day moving average at $660 is a crucial level. A breakout above this resistance could indicate further upside.
Trading volume has increased majorly during price dips, indicating strong buying interest at lower levels. Additionally, volume spikes during sharp reversals indicate possible accumulation by the market.
BNB Dependent on $660 Breakout
A move above $660 could push BNB towards the next resistance levels of $680-$700. If sustained momentum continues, $710 may become the next target.
However, rejection at $660 could lead to a pullback, with $600 being the key support. A break below $600 could lead to further downside, potentially leading to another test of $570-$550.