
- BNB Chain recorded 10 million daily transactions and 15 million monthly stablecoin addresses, reflecting expanding network participation.
- BNB broke through the critical support level, and RSI bounced back from below 50, signaling bulls to take over the short-term market.
- Stablecoin growth and rising transaction activity continue reinforcing BNB Chain’s expanding utility across payments and digital finance.
BNB continues attracting attention as expanding stablecoin activity coincides with improving technical conditions, while blockchain usage data and market structure indicate strengthening participation across the broader ecosystem.
BNB Chain Strengthens Stablecoin Leadership
Recent ecosystem data points to growing stablecoin adoption across the BNB Chain. The latest figures focus on transaction growth and expanding user participation. Network activity continues increasing beyond speculative trading.
A recent social media update outlined several adoption milestones. The post cited approximately 10 million average daily transactions. It also reported nearly 15 million monthly active stablecoin addresses.
Supporting charts indicate four of 2026’s fastest-growing stablecoins operate within BNB Chain. USYC recorded roughly $1.53 billion in net supply growth. USDY and USD1 also posted substantial expansion during the measured period.
Most of those stablecoins retain between 87% and 97% ecosystem concentration. This reflects deep liquidity across the network. It also demonstrates increasing demand for digital dollar infrastructure.
Network Activity Reinforces Ecosystem Expansion
The accompanying research shows BNB Chain controls roughly 24% of active stablecoin addresses. Address growth has advanced steadily since 2021. The trend reflects sustained participation instead of isolated activity spikes.
The same research notes more than 5.3 billion stablecoin transactions since 2025. Those transfers extend beyond decentralized trading activity. Payments, remittances and treasury movements increasingly contribute to network usage.
The charts also indicate expanding stablecoin diversity across the ecosystem. New products continue attracting additional liquidity. Growing asset availability encourages broader blockchain participation.
These metrics collectively point toward strengthening network effects. Additional users attract more liquidity providers and issuers. Greater activity then supports further transaction growth across the ecosystem.
BNB Technical Structure Shows Recovery Attempt
The 4-hour chart presents buyers attempting to stabilize recent weakness. BNB as of writing,trades around $573.96 after recovering from earlier selling pressure. The rebound follows support near the $560-$565 region.
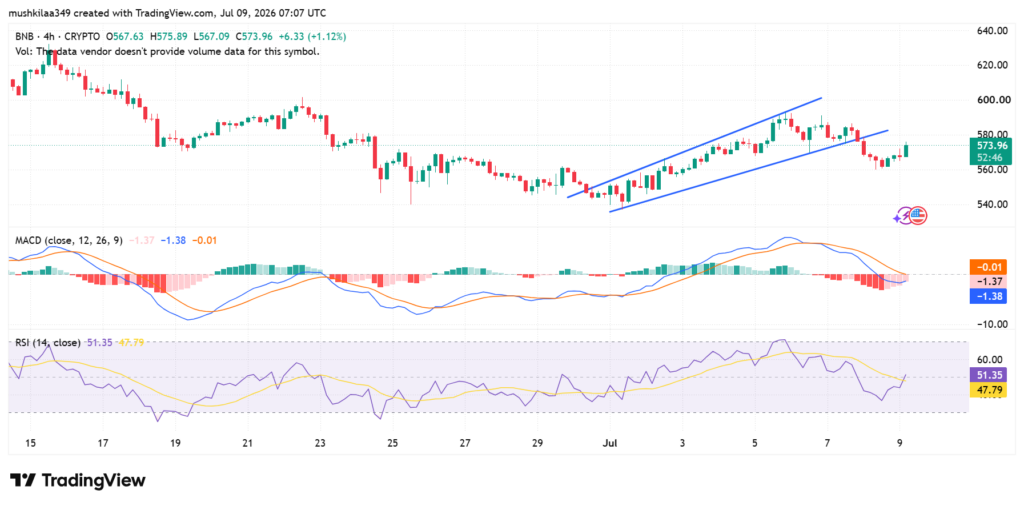
Previous price action developed inside a rising channel before breaking lower. Sellers regained temporary control after resistance near $590-$600. That decline interrupted the earlier bullish structure.
Momentum indicators now show improving conditions despite remaining cautious. MACD remains slightly negative while bearish momentum continues fading. Meanwhile, RSI recovered above 50 after rebounding from weaker readings.
Resistance remains positioned between $580 and $585 following repeated rejections. A move beyond that area could reopen the path toward $590-$600. Otherwise, support around $567-$560 remains essential for maintaining the ongoing recovery structure.