
- Bitcoin has followed a strong bullish pattern since November 2022.
- Bitcoin’s current cycle could target $128K by mid-March 2025.
- With no major risks in sight, Bitcoin’s price may continue to rise.
Since November 2022, Bitcoin has exhibited a strong and consistent bullish wave pattern, where the asset has followed a cyclical movement consisting of multiple phases. The trend begins with 13 weeks of upward momentum, followed by a correction that lasts 25 weeks. After this correction, a 21-week growth phase follows, only to be interrupted again by another 25-week pullback.
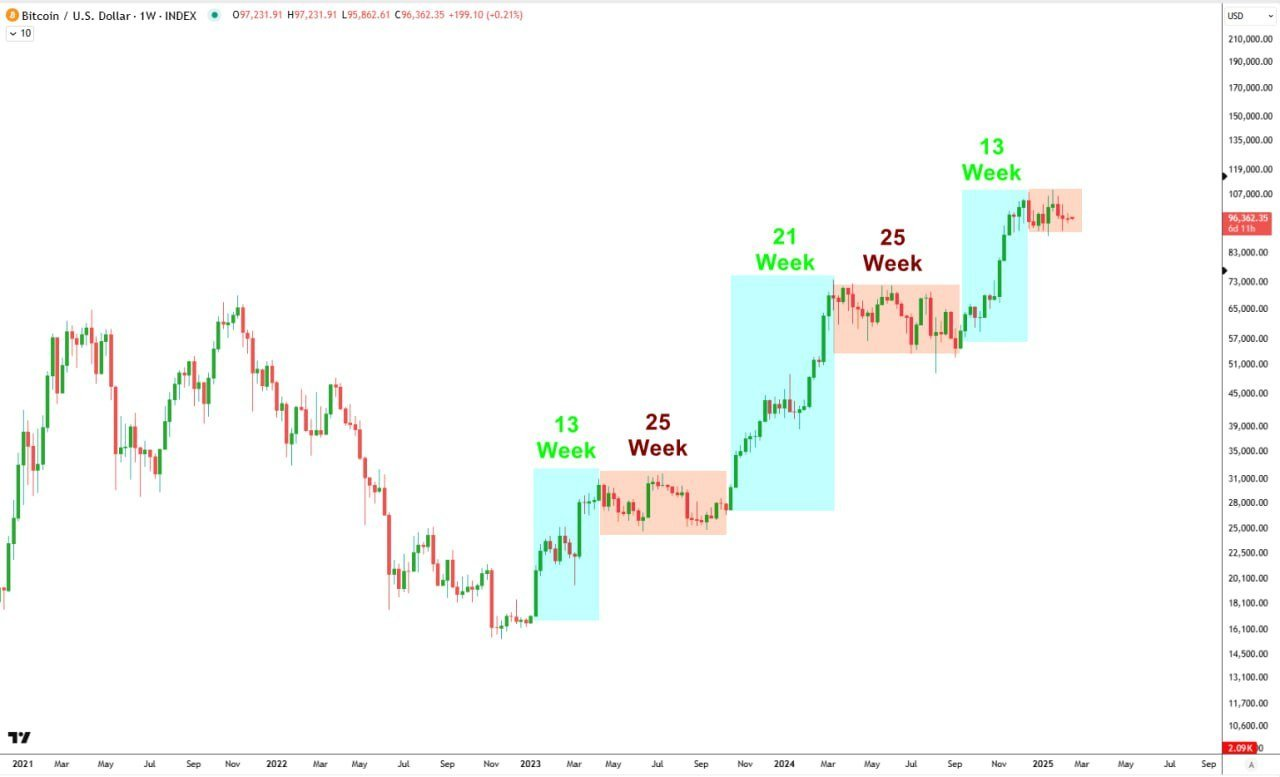
However, as the period progresses, the trend repeats, demonstrating Bitcoin’s ability to move upward in waves. Currently, the market is amid a 13-week upward cycle, and Bitcoin’s price seems poised to continue this pattern with the same level of strength as previous cycles.
The image above, shared by analyst Rose Premium, showcases this repeating pattern. It breaks down Bitcoin’s price movements over the last several years, highlighting the progression from the 13-week upward trends to the pullbacks and continued surges. The most recent data shows Bitcoin in a tight 10-week range, a significant shift compared to the past corrections, which have typically lasted around three weeks.
This 10-week consolidation phase signals that the market might be ready to break free from this range and continue its bullish trajectory. Bitcoin’s past cycles have consistently followed this wave-like structure, with the cryptocurrency showing impressive strength after each correction, and the current cycle is no different.
Bitcoin’s Price Movements: A Cycle of Strong Surges
Looking at the broader trend, Bitcoin’s price has increased significantly since the beginning of 2024, with each surge corresponding to a defined period of growth. In the chart, it is visible that after the 13-week upward period, Bitcoin encountered its first major correction, lasting 25 weeks, followed by 21 weeks of growth. The 25-week corrections have not been as drastic as the major declines of 2021, which is notable.
Despite the pullbacks, the token has maintained a strong bullish structure, suggesting that any correction seen over the past few months has been part of an healthy market cycle. Bitcoin’s price has experienced major surges, reaching new highs, and this structure leads analysts like Rose Premium to believe that the current price action is in line with what we’ve seen in the past.
The 2025 outlook for Bitcoin is equally optimistic, with the analyst predicting that Bitcoin could reach a target price of $128K by mid-March if the trend holds. The chart’s structure and past performance strongly indicate that the digital asset will continue to see growth, especially given that no major negative catalysts have emerged to derail this uptrend.
The analyst compares the current market movement to the more drastic market drops in 2021, suggesting that Bitcoin is on a much more solid footing now, with no apparent downside risks threatening its rise. Momentum remains strong, and as long as the bullish trend continues, Bitcoin could see even further gains in the coming months.