

- Bitcoin’s NUPL is at 0.552, which shows that traders are in profit but still far from extreme greed.
- The market cap is over $1 trillion and continues to grow, which suggests strong support.
- Lower NUPL highs since 2021 mean the market might not see a peak like in past cycles.
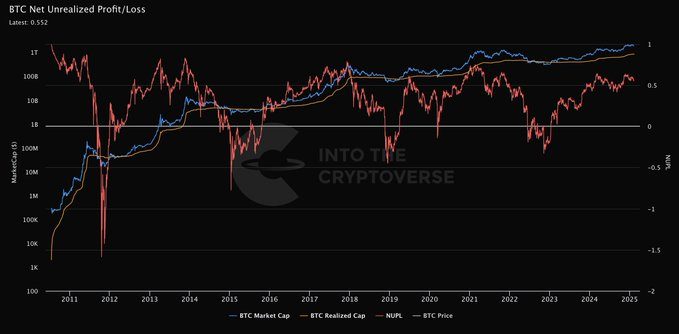
Bitcoin’s Net Unrealized profit/loss stands at 0.552, which historically signals mid-to-late-cycle bullish momentum. According to analyst Benjamin Cowen, this metric places Bitcoin in a profitable zone but raises concerns about a potential peak. BTC’s market cap exceeds $1 trillion, and the realized cap is steadily climbing. The on-chain data suggests resilience, yet declining NUPL highs since 2021 indicate a possible structural shift in Bitcoin’s price action. This balance between profitability and potential market saturation is crucial in determining the asset’s trajectory.
Bitcoin’s Market Cap and Realized Cap Growth—A Sign of Strength?
The market cap (blue line) is in an uptrend, currently sitting at over $1 trillion, while the realized cap has been climbing steadily. This suggests that capital continues to flow into the network, supporting price stability. In previous cycles, Bitcoin’s NUPL exceeding 0.7 marked euphoric phases, leading to eventual corrections. In contrast, the current 0.552 reading suggests that BTC is in a healthy, albeit cautionary, stage where further upside is possible, but risks are emerging.
Past cycles show that when NUPL reached the 0.6–0.7 range, Bitcoin approached cyclical tops before experiencing major pullbacks. The **last recorded peak in November 2021 saw NUPL hovering near 0.75, right before the market correction. However, this time, Bitcoin’s price action follows a different rhythm, with the realized cap maintaining an upward trajectory, potentially delaying the typical cycle peak.
NUPL’s Lower Highs and the 350-Day MA—A Warning Sign?
A key observation in Cowen’s analysis is the declining NUPL peaks in recent cycles. From 2013 to 2017, NUPL consistently reached extreme levels, but since 2021, the metric has failed to reclaim previous highs, suggesting either a maturing market or diminishing speculative excess.
One notable comment on Cowen’s post suggested adding the 350-day moving average (MA) to the NUPL chart, arguing that it has accurately marked cycle tops in the last three bull runs. If applied, the current NUPL level aligns with historical late-stage rallies, but the lack of parabolic expansion in Bitcoin’s market cap makes this cycle’s trajectory less predictable.
What’s Next? Bitcoin’s Potential Path Based on NUPL Data
With NUPL at 0.552, Bitcoin remains in profitable territory but not yet at a speculative peak. The market cap’s steady growth and the realized cap’s resilience indicate that Bitcoin’s uptrend remains intact. However, lower NUPL highs since 2021 suggest that each cycle may deliver diminishing returns.
If Bitcoin’s NUPL pushes above 0.6, historical trends suggest a potential distribution phase could follow. Traders watching for a final leg-up should be cautious, as past cycles indicate that corrections tend to follow once NUPL moves into the 0.7 zone. While there is no immediate sign of reversal, Bitcoin’s price movement remains data-driven—and the charts don’t lie.