
- Bitcoin’s MVRV Z-Score remains between 2 and 4 in 2025, indicating the market is not near historic overvaluation levels yet.
- Historical peaks only occurred when MVRV Z-Score exceeded 7, and current metrics signal a continued mid-cycle structure for Bitcoin.
- Rising market and realized caps, along with a low Z-Score, show Bitcoin is positioned for further gains without overheating signs.
Bitcoin’s MVRV Z-Score currently fluctuates between 2 and 4, suggesting the asset is far from a cycle top. Doctor Profit recently stated that Bitcoin’s position on the Z-Score metric indicates it is not near overvaluation. Historically, red zones above a Z-Score of 7 marked macro cycle peaks. The current score sits well below that threshold, suggesting room for further upward price movement. According to Doctor Profit, blue zones historically marked bottoms, while red zones marked tops. Presently, Bitcoin’s MVRV is slightly above 2—closer to previous accumulation zones.

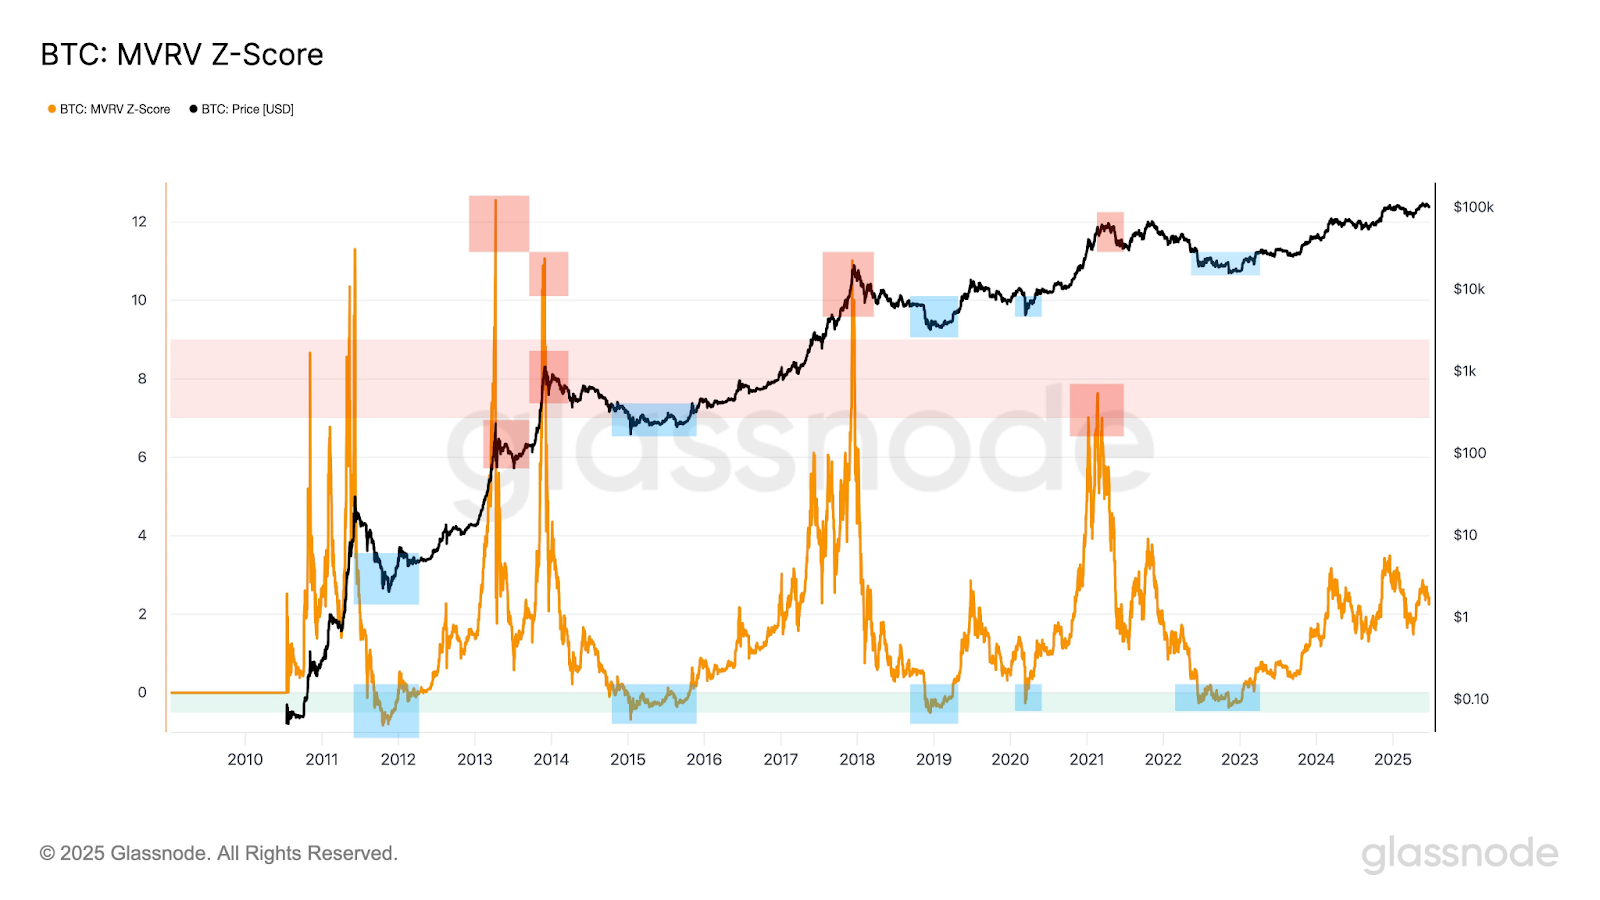
Source: Doctor Profit
Historical Peaks and Market Reversals
The MVRV Z-Score quantifies the distance between Bitcoin’s market cap and realized cap. High readings indicate overvaluation, while low readings show undervaluation. In 2011, the score surged past 12, coinciding with Bitcoin’s price spiking above $30. Subsequently, a steep decline followed.
In 2013, the Z-Score again topped 10 before Bitcoin corrected from a peak above $1,000. Moreover, the 2017 bull market produced another spike near 10, preceding Bitcoin’s drop from $20,000. In 2021, Bitcoin hit $65,000 as the Z-Score approached 8. Consequently, a bear phase followed with the score dropping below 1. These peaks consistently marked major cycle tops.
2025 Outlook Based on Current Valuation
Currently, Bitcoin trades with an MVRV Z-Score in a moderate valuation zone. Stockmoney Lizards noted that past tops required a score exceeding 7. Hence, with the current score near 2, the market appears far from overheated.
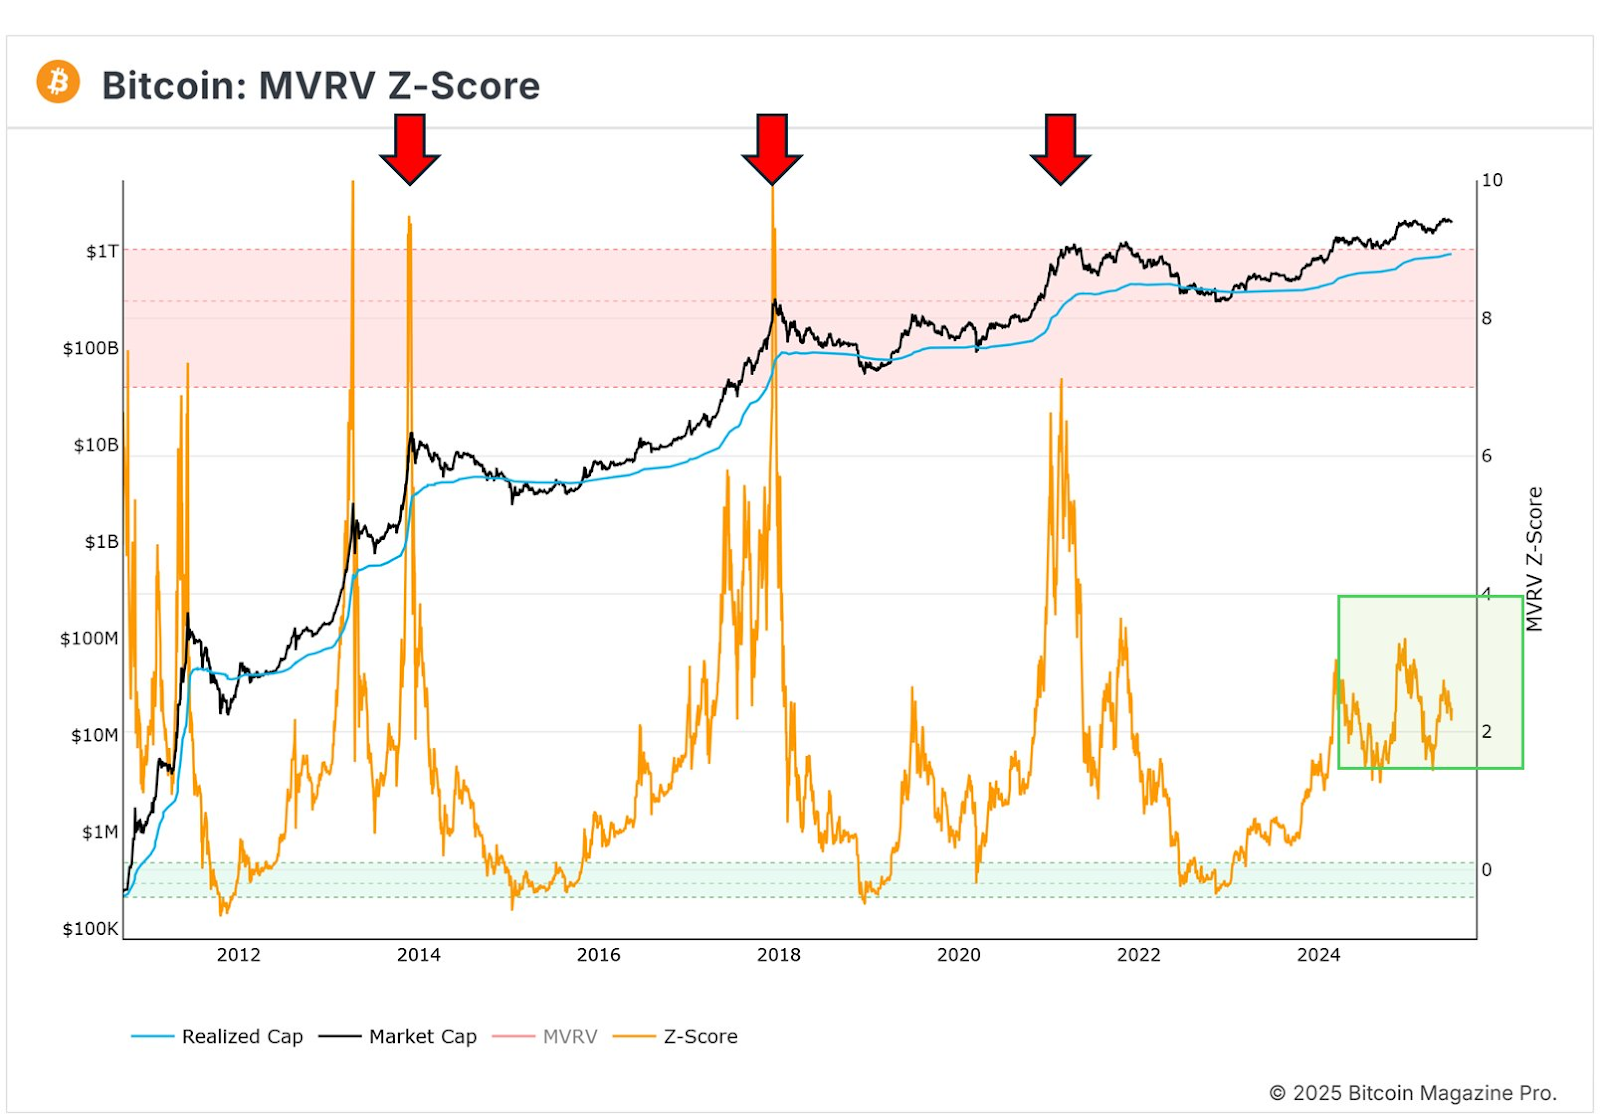
Source: StockMoney Lizards
Realized Cap, represented by a blue line, continues its steady climb across cycles. Market Cap is also recovering after the 2022 decline. Additionally, Bitcoin’s price has been trending upward since 2023, supported by strong realized value growth.
From 2022 to early 2023, the Z-Score hovered below 1, signaling historic undervaluation. That phase aligned with Bitcoin trading below $20,000. Since then, price and Z-Score have risen steadily.
Moreover, no recent MVRV spike has breached the red zone. This pattern aligns with a mid-cycle structure rather than a terminal peak. Consequently, technical data supports the notion that Bitcoin retains bullish potential without signs of widespread profit-taking.