
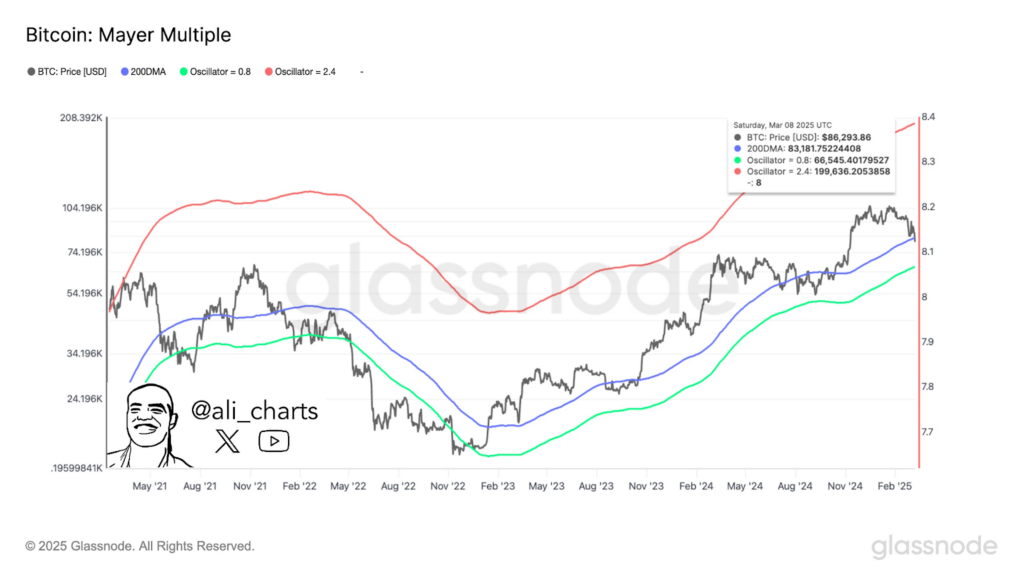
- Bitcoin price dropped below the 200–day moving average, which is an indicator of only $83,187.75.
- Mayer Multiple oscillator reaches 0.8 showing that the conditions are near oversold.
- Support is essential because Bitcoin approaches a major level of the market.
Bitcoin’s price is technically trading beneath the 200-day moving average. The coming major support level, according to Mayer Multiple, would be $66,000. Bitcoin price as of 8 March 2025 was $86,293.86, which is very much lower than its peak of $208,392.39 in May 2021. The analysis in this kind of modeling through the Mayer Multiple gives a critical understanding of the Bitcoin market conditions and up-front flexible models of support levels in a highly volatile crypto environment.
Bitcoin Price Trends: Current and Historical Context
Bitcoin, as the trend in price provides from the above chart, has shown crucial movements against the 200 days moving average. Recently, prices dipped below this moving average-a strong historical indicator of Bitcoin’s position in the market. As of the last figure, the 200-day moving average was at $83,187.75. This is a pivot point for Bitcoin that will signal possible turning inflections of price momentum.
Looking back, it can be primarily said that the Mayer Multiple’s measurements of the oscillating function between 0.8 and 2.4 are now pegged at 0.8, which suggests near-oversold conditions. This means Bitcoin may be less-priced concerning its long-term course, positioning itself close to important support levels. Further, the past has shown that the value of the indicator reaching similar lows has usually preceded significant rebounds. Still, considering the present situation, caution still needs to be exercised since the market is uncertain.
Mayer Multiple in Predicting the Support Levels of Bitcoin
The Mayer Multiple serves to measure Bitcoin’s price against its 200-day moving average. Smaller readings for the Mayer Multiple often represent price discounts. A value below 1.0 on the Mayer Multiple, as is currently seen with the 0.8 reading of the oscillator, has historically indicated that Bitcoin is generally selling at a discount. The historical peak at 2.4 indicates that Bitcoin was in over-bought conditions from other rallies; for instance, the one from 2021. This time, with the reading of the oscillator standing at 0.8, the market could be heading to such recovery periods, yet still, a strong support of $66,000 must be passed for the continuation of upward momentum.
Moreover, oscillating between green and red zones in the chart is highly suggestive of a tug of war between the buyers and sellers. The lower risk levels of the green zone underbought Bitcoin while the red zone is indicative of overbought conditions. Thus, Bitcoin is currently in a more favorable position, toward the green zone, indicating possible accumulation benefits.