
- Bitcoin’s 2025 bull cycle mirrors past trends, with strong momentum after breaking key resistance, signaling further gains.
- Historical patterns show Bitcoin surges post-halving, reinforcing bullish sentiment as it enters a potential parabolic phase.
- Key breakout levels and support zones confirm Bitcoin’s uptrend, with investors eyeing new highs in the coming months.
Bitcoin’s ongoing bull cycle exhibits a familiar pattern, signaling strong upward momentum. The leading cryptocurrency recently surged past $105,204, confirming a bullish continuation. Historical data suggests Bitcoin follows a cyclical trend, aligning with halvings that drive price acceleration. Crypto analyst Rekt Capital highlights key breakout points that mirror past market cycles. Consequently, Bitcoin’s price action suggests further gains as it enters the parabolic phase.
Bitcoin’s Bull Market Progresses Rapidly
Bitcoin has reached 77.2% progress in its current bull cycle. The price recently surpassed previous resistance levels, indicating strong buyer confidence. Moreover, an additional rising trend is indicated by the breakout from a downward trendline. The price of Bitcoin has traditionally accelerated, accumulated, and broken out in a repeated pattern.
Each previous cycle—2017 and 2021—exhibited similar behavior. After breaking key resistance levels, Bitcoin entered a rapid upward trajectory. Notably, the 2025 cycle shows the same structure, reinforcing bullish market sentiment. Hence, investors anticipate further price appreciation as Bitcoin progresses toward its next peak.
Historical Patterns Confirm Bullish Outlook
Rekt Capital’s analysis highlights Bitcoin’s consistent post-halving rally structure. The data divides Bitcoin’s price history into four-year intervals, aligning with halving events. Bitcoin’s supply shock after each halving historically triggers a strong price surge. The 2016 and 2020 halvings led to parabolic gains in subsequent years. Similarly, the 2024 halving appears to have initiated another bull run.
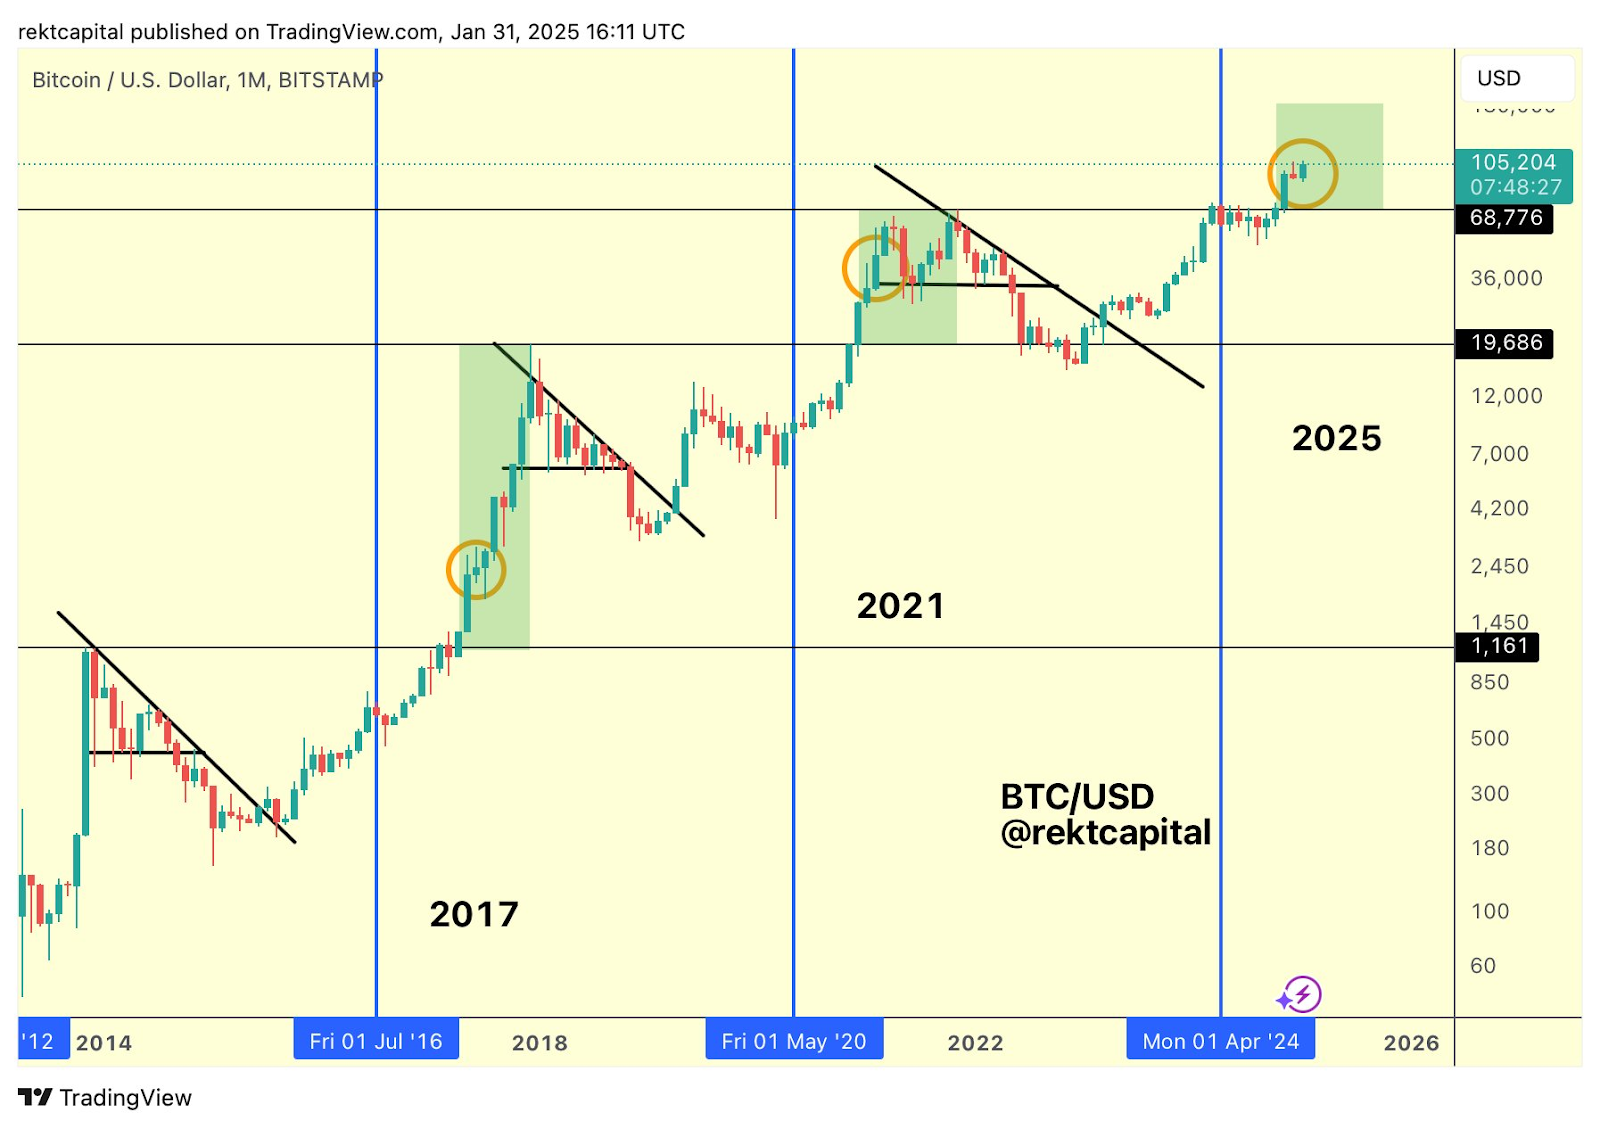
Yellow circles mark early breakout points before major rallies. In previous cycles, these points confirmed bullish trends, leading to exponential gains. Likewise, Bitcoin’s recent breakout indicates continued upward momentum. The green-shaded areas on the chart depict post-breakout rallies, reinforcing the bullish case.
Key Resistance and Support Levels
Horizontal black lines represent critical support and resistance levels. The $19,686 level, which was resistance in 2017, later acted as support in 2022. Recently, Bitcoin broke above $68,776, confirming a bullish breakout. These price levels play crucial roles in determining future market movements. If Bitcoin follows past trends, its price could continue surging in the coming months.