
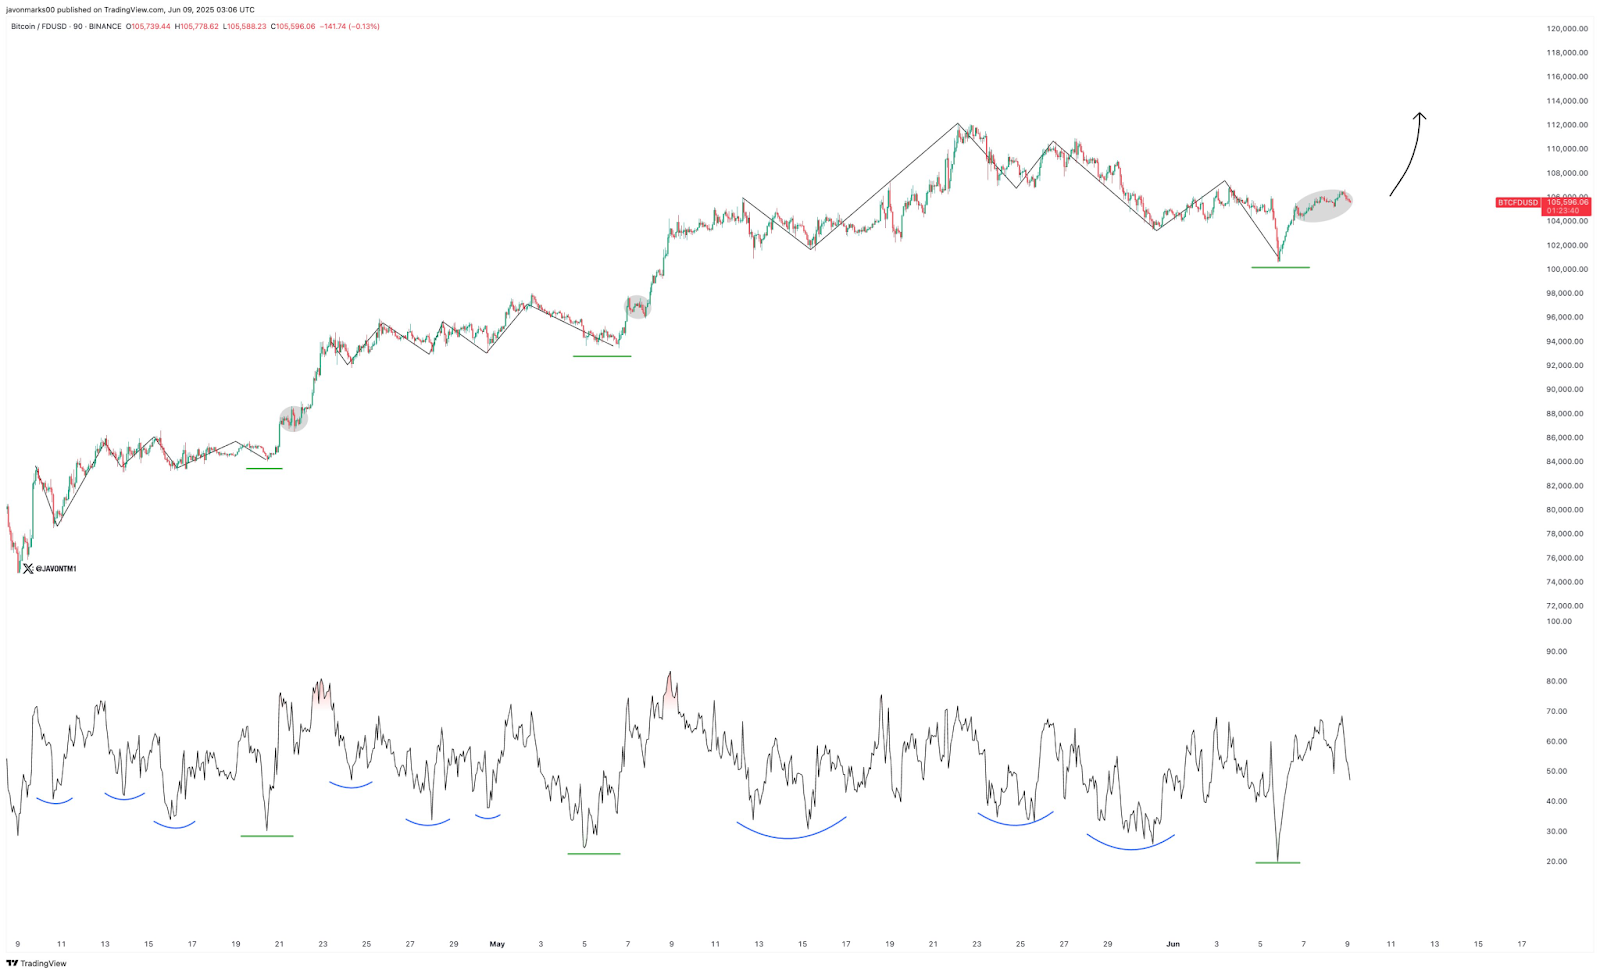
- Bitcoin’s explosive rally to $112K highlights strong bullish momentum while GameStop’s price action fails to mirror BTC’s breakout strength.
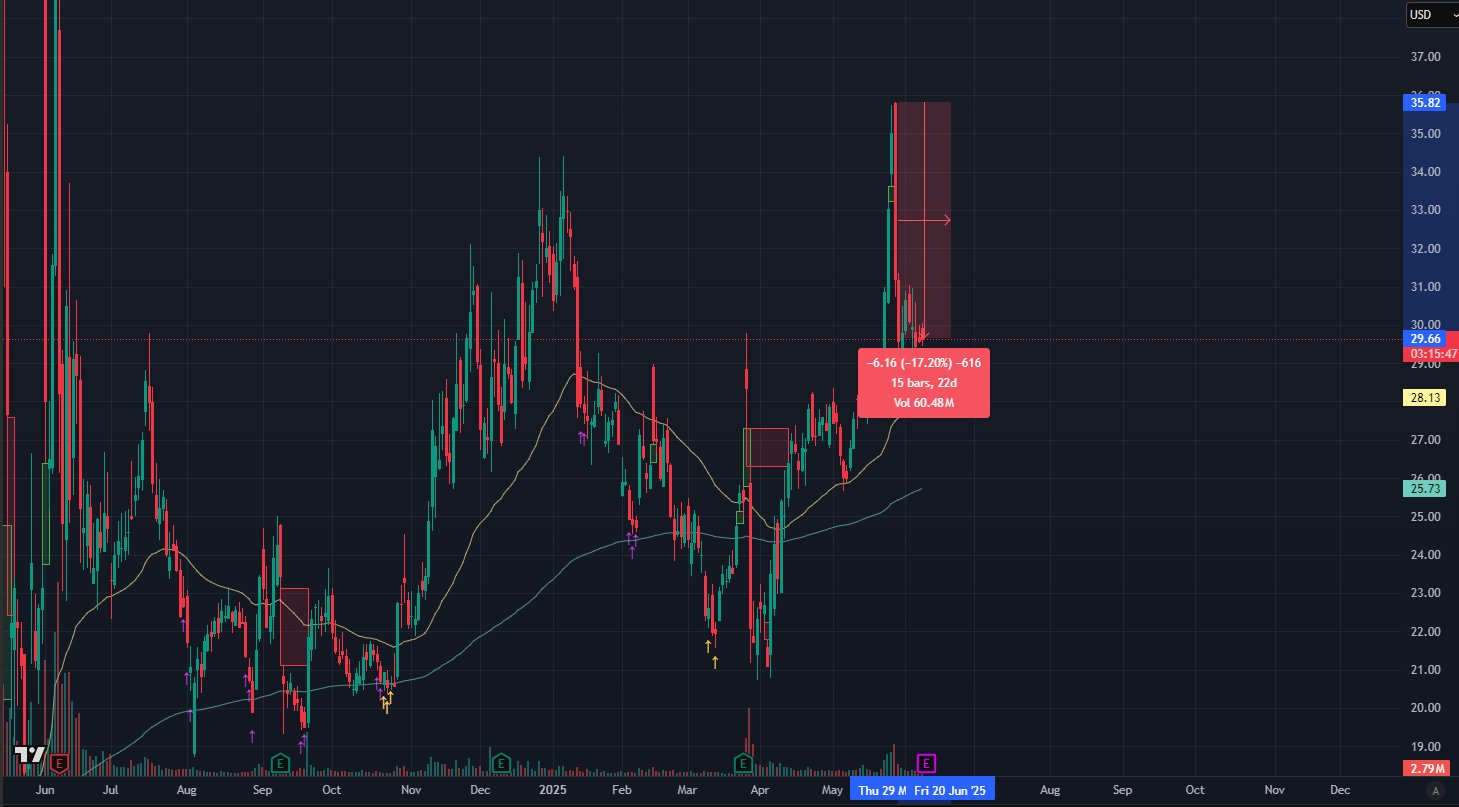
- Despite GameStop buying BTC near $108K, its stock remains 17% down, debunking the theory that it triggered a market-top reaction.
- Bitcoin maintains a strong technical setup with rising support levels, cooling RSI, and expanding volume, signaling continued market confidence.
The cryptocurrency’s recent price action shows a strong positive trend, rising from $70,000 in April to $112,000 in June. Javon Marks identifies several technical indicators that suggest a prolonged upward trend. Early in April, the rally got underway, bringing Bitcoin above $80,000 with robust purchasing volume. May and June saw the price spike continue, reaching a new all-time high. The technical structure also shows bullish activity, with higher highs and support remaining stable at the $80,000 and $90,000 levels.
Source: Javon Marks
Momentum Builds with Strong Support Zones
Besides strong price movement, Bitcoin’s RSI patterns also confirm bullish strength. During the rally, several overbought signals emerged, especially during May. However, each correction proved modest, offering fresh buying opportunities. Additionally, Bitcoin broke the psychological $100,000 barrier in late May. This breakout came with a spike in trading volume, confirming institutional and retail participation. Price continued to rally, reaching $112,000 by early June.
Moreover, the overall market structure remains intact. Upward-sloping moving averages support the trend, while support levels remain firm despite recent pullbacks. Hence, the bullish setup appears structurally sound. The RSI has now returned to neutral levels near 50, signaling a possible cooldown before further moves.
GameStop Theory Debunked Amid Bitcoin Rally
Meanwhile, Reese Politics challenges a widely circulated theory connecting GameStop’s BTC purchase with its stock decline. GameStop bought 4,710 BTC when Bitcoin hovered around $108,000. Critics previously claimed GME’s decline was due to buying the top. However, Bitcoin has returned to that price range, while GME remains down 17% from its post-announcement high. Consequently, this invalidates the earlier narrative and underscores a disconnect between Bitcoin’s strength and GME’s price behavior.

Source: Reese Politics
Additionally, the chart data shows that GME experienced heavy volatility after the announcement. Prices surged to $36 before dropping sharply to $29.66. Support now lies near $25-$26, while resistance formed around $35. Short-term moving averages reflect the correction, but the longer-term trend remains upward. Volume continues to spike during sharp moves, hinting at active trading sentiment.
Both Bitcoin and GME experienced momentum-driven price changes. However, Bitcoin’s structure remains bullish, while GME shows signs of exhaustion. The divergence emphasizes the need for distinct technical analysis across assets.