
- Bitcoin breaks 2-year resistance, aiming for $220K-$320K based on bullish patterns.
- Volume surge supports BTC breakout, confirming strong buying interest near $69,544 level.
- Long-term patterns hint at potential Bitcoin rally, with projections up to $380K.
Bitcoin technical breakout has captured the attention of traders and analysts alike, as the cryptocurrency breaches critical resistance levels, signaling the potential for an explosive price rally.
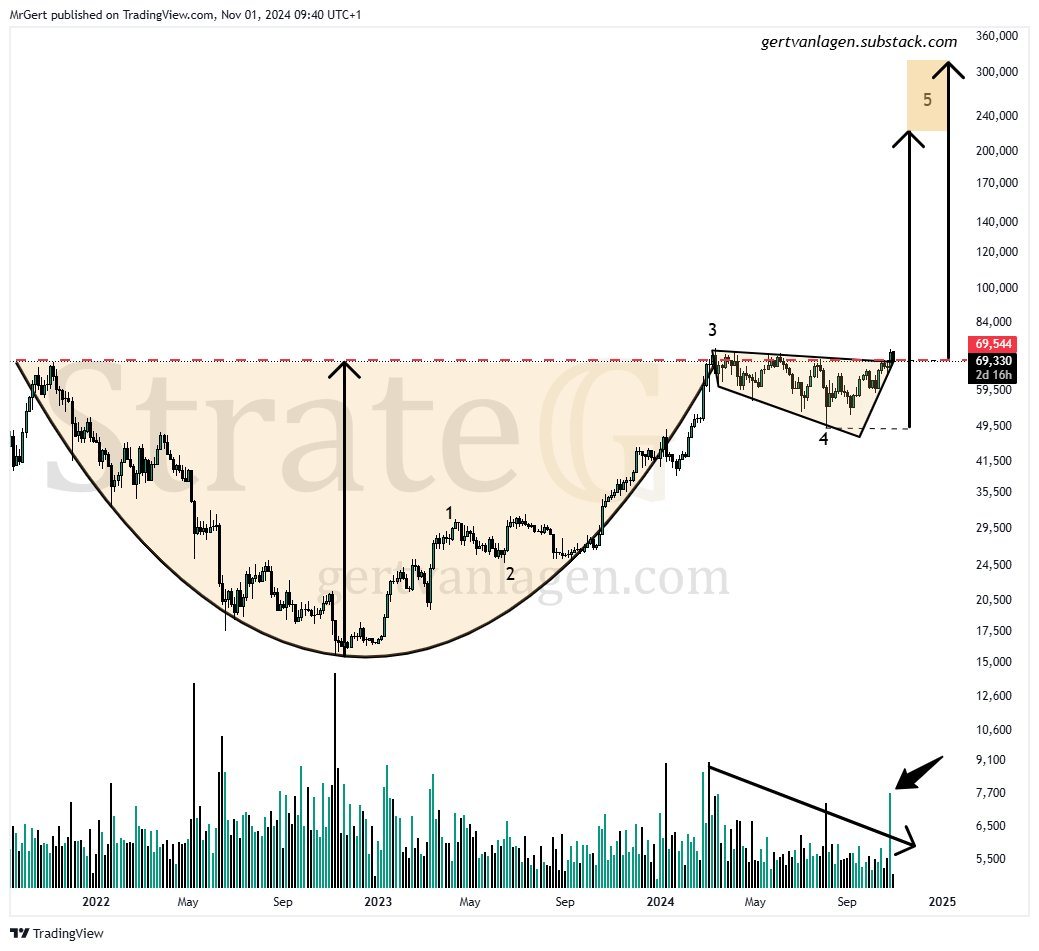
Following an extended two-year “Cup and Handle” formation from early 2022 to mid-2024, Bitcoin’s price recently moved past the red-dotted horizontal resistance line at approximately $69,544. This technical milestone, confirmed by an increase in trading volume, suggests Bitcoin may be on a strong upward trajectory, with projected targets in the range of $220,000 to $320,000, possibly within the next year.
The “Cup and Handle” pattern is a classic technical signal often interpreted as bullish in nature, marking a gradual recovery from previous lows. Bitcoin’s recent breakout above this formation’s neckline has prompted a test of its previous resistance as a new support level, further reinforcing the bullish forecast.
Source: Gert van Lagen
Based on technical measurements, Bitcoin’s target price range is between $220,000 (measured from the handle low) and $320,000 (calculated from the breakout level). The chart setup shows the breakout as a pivotal moment that could steer the price toward new all-time highs in late 2024 or early 2025.
The analysis of volume patterns further strengthens this outlook. While volume declined during the ascending triangle segment of the pattern, a spike accompanied the breakout. This volume surge typically confirms the breakout’s robustness, suggesting that buying interest remains strong as Bitcoin establishes a new support base above previous resistance levels.
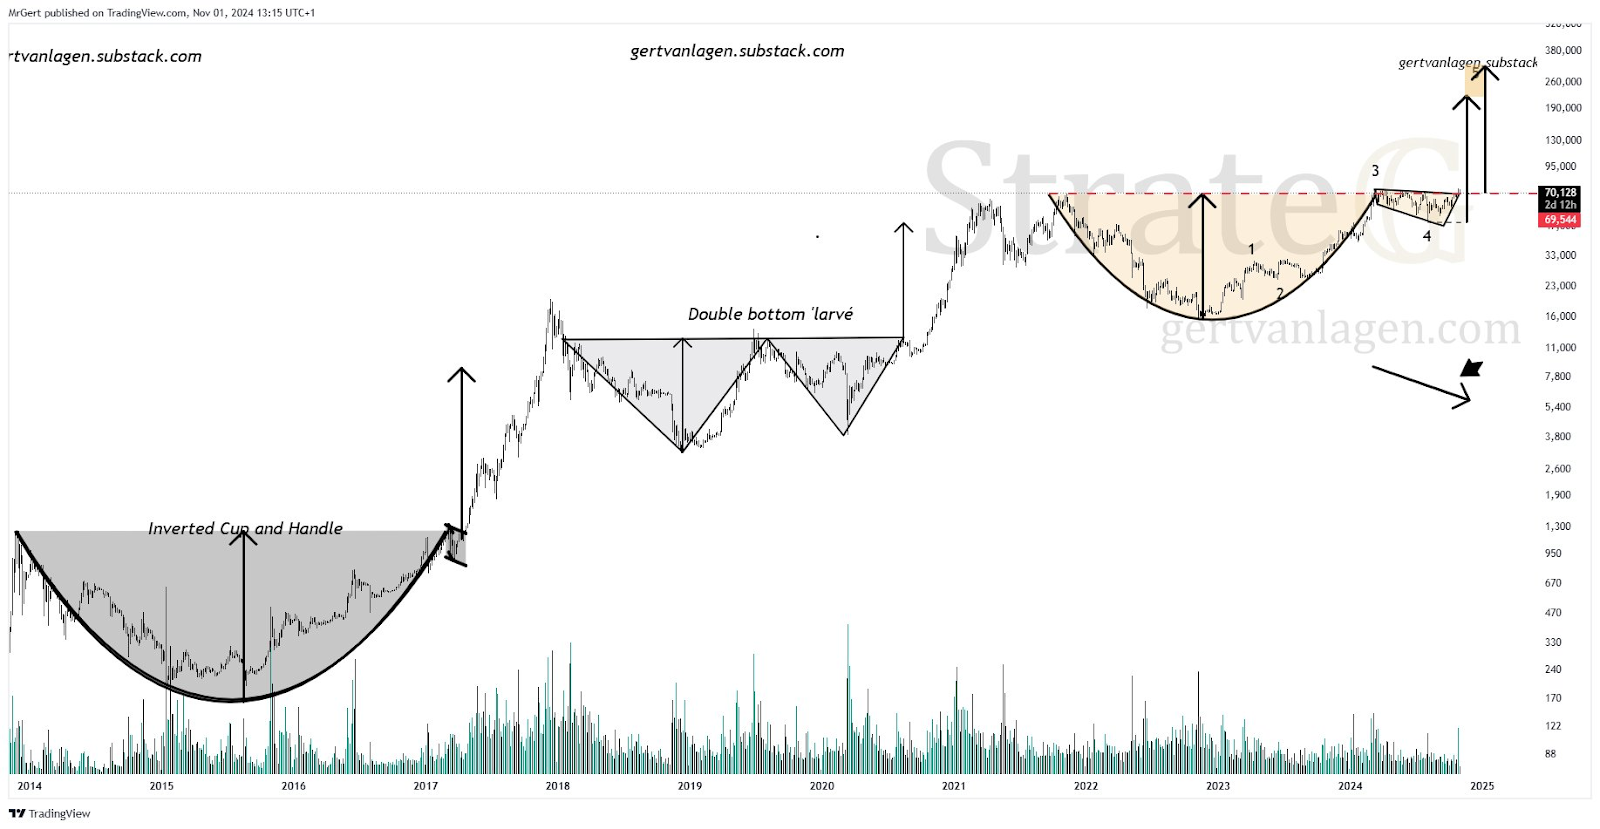
Analyst Gert van Lagen has emphasized using a logarithmic chart to gauge Bitcoin’s long-term targets. According to van Lagen, a linear chart may underestimate Bitcoin’s potential highs in cases of historic rallies.
By employing a logarithmic scale, the projected targets align more closely with previous bull runs, illustrating a sequence of bullish patterns. Bitcoin’s journey has displayed key formations, including an “Inverted Cup and Handle,” a “Double Bottom Larvé,” and the current “Cup and Handle,” each of which has been associated with substantial price appreciation.
Source: Gert van Lagen
Since 2014, Bitcoin’s price has followed a series of bullish technical formations, each associated with major rallies. In 2019, a double-bottom pattern emerged, preceding a strong uptrend. This was succeeded by the current rounded bottom formation, nearing completion as of late 2024.