
- Mt. Gox’s 11,834 BTC transfer stirs market speculation, signaling potential upcoming shifts in Bitcoin’s price dynamics.
- Arthur Hayes predicts Bitcoin’s bottom near $70K, advising patience until financial downturns prompt policy easing.
- Technical analysis reveals a bullish Head and Shoulders pattern, projecting Bitcoin’s potential surge towards $350,000.
The failed cryptocurrency exchange Mt. Gox has been making huge Bitcoin (BTC) transactions again. Mt. Gox made a transfer of 11,834 BTC that is worth roughly $910 million recently. From this amount, 11,502 BTC amounting to $885 million moved to a fresh wallet.

Additionally, 332 BTC, around $25.5 million, transferred to a warm wallet. This movement follows a notable transaction just five days prior, where 166.5 BTC was sent to BitGo. The transfer likely relates to creditor repayments. Hence, speculation grows that the recent 332 BTC could be moved out soon, impacting market dynamics.
Arthur Hayes Offers Insights on BTC Correction
BitMEX co-founder Arthur Hayes provided his take on the market trajectory of BTC. He foresees Bitcoin’s price bottoming out at $70,000. This represents a 36% correction from its all-time high of $110,000 and is in line with historic patterns within the markets. Hayes cautions against impatience. He anticipates that a broader financial downturn, particularly in traditional finance (TradFi), will precede a bullish reversal.
Should major indices like the S&P 500 (SPX) and Nasdaq (NDX) decline, and a TradFi entity falter, central banks may respond with easing policies. Hayes advises that risk-averse investors wait for these policy changes before deploying more capital. This approach, though conservative, could mitigate prolonged exposure to potential market stagnation and unrealized losses.
Technical Analysis Suggests Bullish BTC Outlook
Adding to the optimistic narrative, Crypto analyst, Trader Tardigrade, bullish technical pattern for Bitcoin. He identified a classic Head and Shoulders formation, signaling a strong continuation trend. The Left Shoulder (LS) formed around mid-2021, followed by a sharp price dip. The Head developed in late 2021 with another peak, succeeded by a steep decline. The Right Shoulder (RS) emerged in 2024 as Bitcoin rebounded but didn’t surpass the previous high.
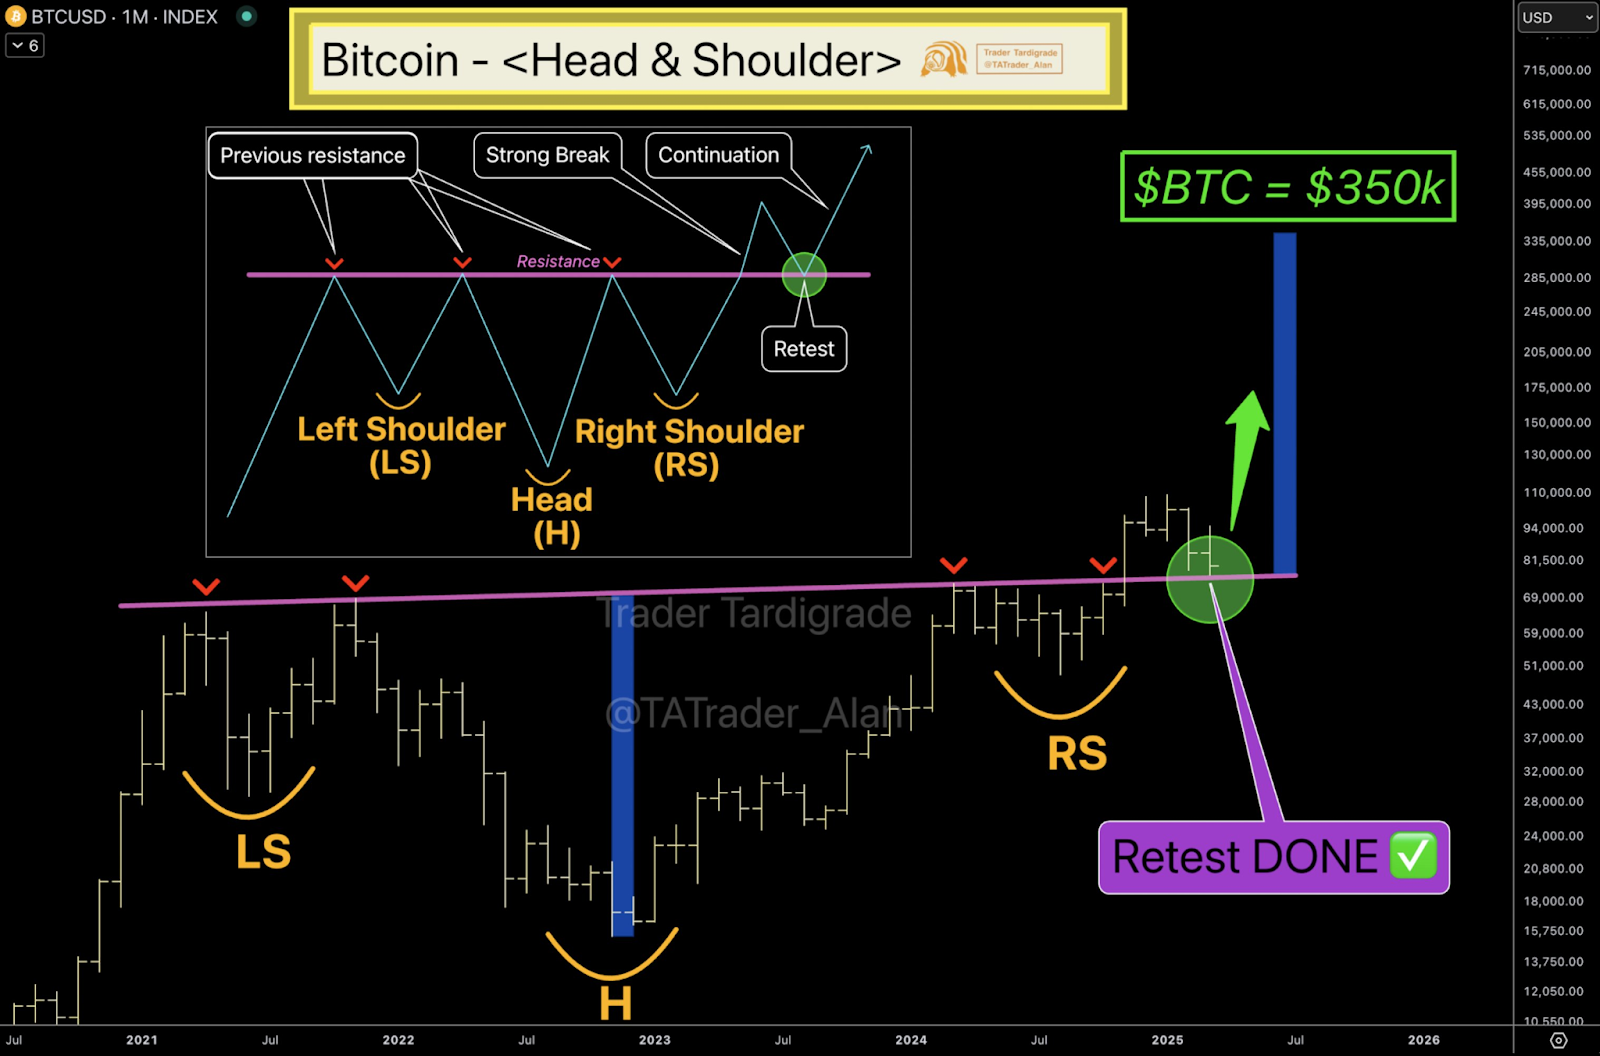
BTC broke through a persistent resistance level in early 2025. A successful retest of this level confirmed the breakout’s strength. Consequently, the chart now projects Bitcoin’s price to target an ambitious $350,000. This estimation derives from the Head’s height mirrored above the neckline breakout. The technical indicators, coupled with recent market movements, point towards a potentially bullish BTC trajectory.