
- Whales added 84,000 BTC in July 2024, highest since October 2014, signaling increased interest and potential bullish sentiment.
- Bitcoin’s market cap drops by $109.202B (-9.52%) to $1.038T, contrasting with rising whale activity, suggesting a complex market.
- RSI drops to 42.69 and MACD shows bearish momentum, signaling potential for further declines but watch for support and trend reversals.
In July 2024, Bitcoin saw a substantial surge in accumulation by large holders, often referred to as “whales.” These major investors added over 84,000 BTC to their portfolios, marking the highest level of accumulation since October 2014.
This development indicates a notable increase in interest from large holders in the market, potentially signaling a shift in sentiment towards Bitcoin’s future prospects. The sharp increase in whale activity highlights a potential bullish outlook among these large holders, who may be positioning themselves for anticipated market gains.
Market Cap Decline Amid Whale Activity
Despite the surge in whale accumulation, Bitcoin’s market cap has had a sharp decline. As of the latest weekly data, the market cap stood at $1.038 trillion, reflecting a significant drop of $109.202 billion, or 9.52%. The weekly candlestick pattern shows a large red candle, indicating this substantial decrease.
The current market cap level may act as a support point, but previous highs near $1.3 trillion could serve as resistance if the market attempts to recover. This decline in market cap contrasts with the accumulation trend, suggesting a complex market environment where large holders may be preparing for future market shifts.
Technical Indicators Signal Bearish Momentum
The technical indicators on the Bitcoin market cap chart point to a bearish trend. The Relative Strength Index (RSI) has dropped to 42.69 from 59.13, falling below the critical 50 level, which signals increasing bearish momentum.
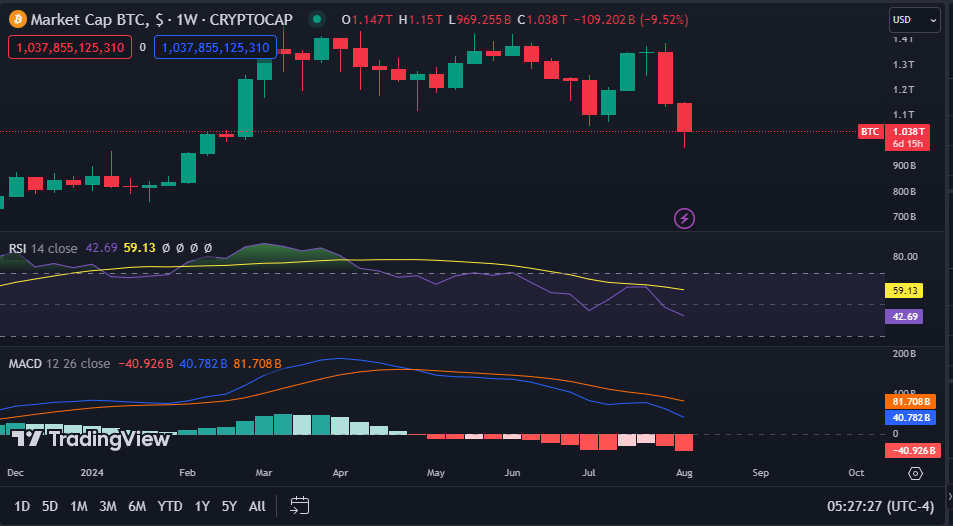
Source: TradingView
However, the RSI remains above the oversold threshold of 30, leaving room for further declines before a potential reversal might occur. This bearish trend is further supported by the Moving Average Convergence Divergence (MACD) indicator.
The MACD line is currently at -40.926 billion, with the signal line at -81.708 billion, and the histogram showing increasing negative values, all of which confirm strengthening bearish momentum.
Key Levels and Trends to Monitor
The market is showing clear signs of bearishness, with both the RSI and MACD indicating downward pressure. The market should closely monitor key levels, such as the support around the $1.038 trillion mark and any approach towards the oversold RSI territory, which could signal a potential reversal.
Additionally, watching the MACD for any signs of convergence with the signal line might provide early hints of a trend change. Despite the bearish outlook, the recent accumulation by whales introduces an intriguing dynamic that could influence the market in unexpected ways.