
- Bitcoin rallied from $60K support to nearly $74K, gaining about 23% during the recent recovery phase.
- RSI near 60 and a positive MACD signal suggest buyers still dominate short-term momentum.
- Key resistance sits at $74K–$74.5K, while support levels appear at $72.8K, $71.5K, and $70K.
Bitcoin climbed toward the $74,000 level between March 8 and March 16 after rebounding from $60,000 support, according to market data and analyst Crypto Patel. The digital asset recently traded near $73,700 following a steady rally. Crypto Patel outlined potential price paths as traders monitor resistance levels and momentum indicators.
Price Structure Shows Steady Climb
Bitcoin price action during the period showed a gradual upward trend. The asset moved from around $67,000 to nearly $74,000 within days. Bitcoin first traded between $67,000 and $68,000 early in the period. However, buyers gradually pushed the price above $70,000.
The market then consolidated briefly around $71,000. Soon after, Bitcoin extended gains toward the $74,000 resistance area. Crypto Patel noted that Bitcoin previously bounced from $60,000 support. Since that level held, the price has climbed roughly 23 percent.
Meanwhile, the analyst said $73,700 now acts as intermediate resistance. He added that $74,000 to $74,500 represents a key resistance zone. Crypto Patel also outlined a broader roadmap. According to the analyst, Bitcoin could move toward $80,000 if $60,000 support remains intact.
Momentum Indicators Remain Positive
Technical indicators show strong momentum despite a minor pullback. Notably, the Relative Strength Index currently reads 60.02. Earlier during the rally, the RSI moving average approached 66.81. At that point, the indicator moved close to the 70 overbought level.

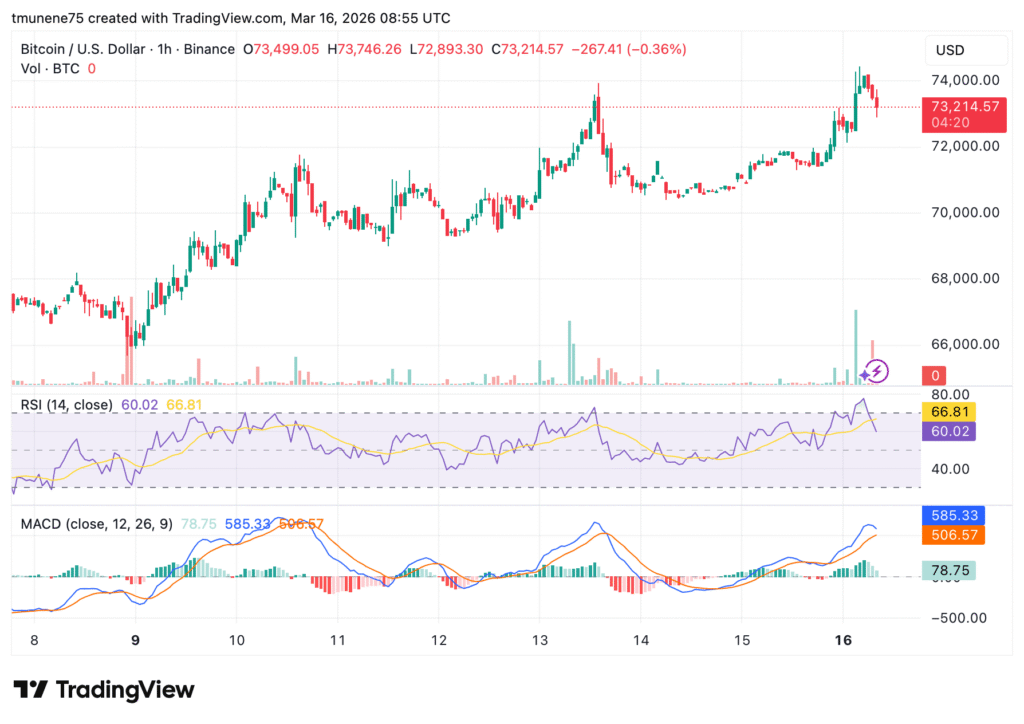
However, RSI later cooled slightly toward the 60 level. Even so, the reading remains above the neutral 50 mark. This position suggests buyers still dominate short-term momentum. Therefore, market participants continue monitoring the indicator for directional clues.
Key Support And Resistance Levels
The MACD indicator also supports the current momentum structure. Bitcoin’s MACD line is near 585.33, above the signal line around 506.57. Meanwhile, the histogram prints a positive reading of 78.75. However, the bars have narrowed slightly after the recent rally.
This change suggests momentum slowed temporarily after the upward surge. At the same time, price encountered resistance near $74,000. According to the chart structure, immediate support appears at $72,800.
Below that level, traders monitor $71,500 and $70,000. Crypto Patel also described a downside scenario. If $60,000 breaks, he identified $45,000 to $50,000 as an institutional buy zone.