
- BTC’s RSI Bollinger Band % mirrors past breakouts, signaling a possible rally before the next cycle peak.
- Bullish RSI divergence suggests Bitcoin could repeat past price surges, hinting at strong upward momentum.
- Despite low market confidence, Bitcoin’s support zone shows signs of a rebound, pointing to a potential rally.
Bitcoin’s price movements align with historical trends, reflecting past market cycles. Analysts monitor RSI Bollinger Band % levels and bullish divergence signals for potential breakout indicators.
Bitcoin Approaches Key RSI Bollinger Band % Level
Technical Analyst CryptoCon analyzed Bitcoin’s price cycles using RSI Bollinger Band % data. Bitcoin has reached critically low RSI Bollinger Band % levels, which have preceded market breakouts in past cycles.
CryptoCon’s analysis identifies Bitcoin’s market phases, including bear market breakouts, early tops, all-time high (ATH) breaks, and cycle tops. Previous instances in 2013, 2017, and 2021 followed similar trends, with market cycle tops forming nine months after Phase 4 completion.

His current data shows Bitcoin nearing another ATH, resembling March 2017. This phase completion has historically preceded cycle tops, with December 2024 projected as the next peak.
The RSI Bollinger Band % time frame highlights a consolidation phase before sharp price movements. Analysts note that low confidence and altcoin weakness align with past bullish breakouts.
Bullish Divergence Pattern Signals Market Shift
Titan of Crypto examined Bitcoin’s market structure, focusing on RSI bullish divergence patterns. Historical data shows previous bullish divergence points. These patterns have led to major price rallies in past cycles.
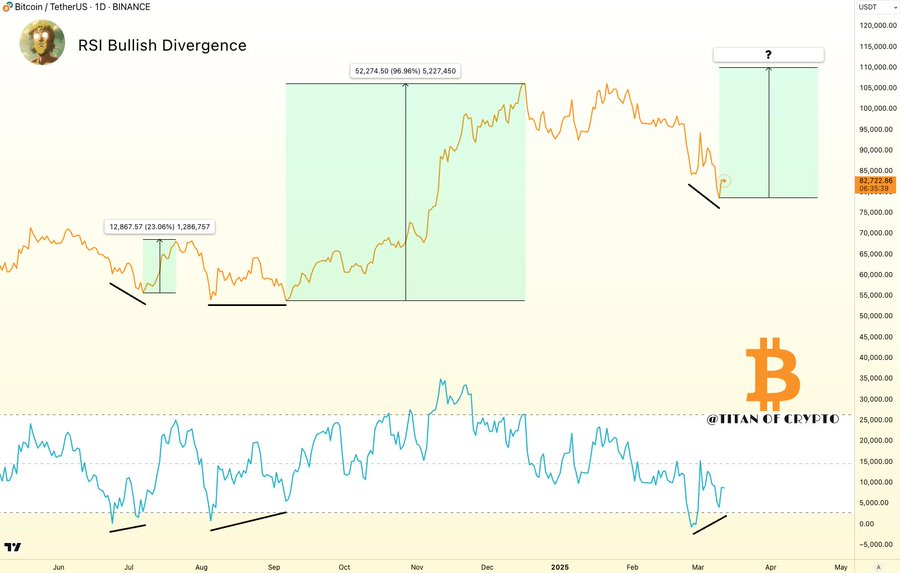
The analyst identified two key divergence points in mid-2023, resulting in 23% and 96% price surges. Bitcoin’s latest RSI divergence indicates another potential price increase, similar to past trends.
Bitcoin trades at approximately 85,000 USDT, with RSI forming higher lows despite price declines. The time frame of Titan of Crypto highlights a structural support zone, suggesting a possible relief rally.
The analyst also noted that past bullish divergences formed near critical price levels, reinforcing breakout potential. The RSI trend signals a shift in market momentum, mirroring previous rally conditions. Market watchers project that if the pattern continues, Bitcoin may see another price increase, following the established cyclical behavior observed in past market trends.