
- Bitcoin recovered from $88K and is now at $92,882 with strong buying.
- If it breaks past $100K, the next target could be $124K very soon.
- A failure to break resistance may lead to more sideways price action.
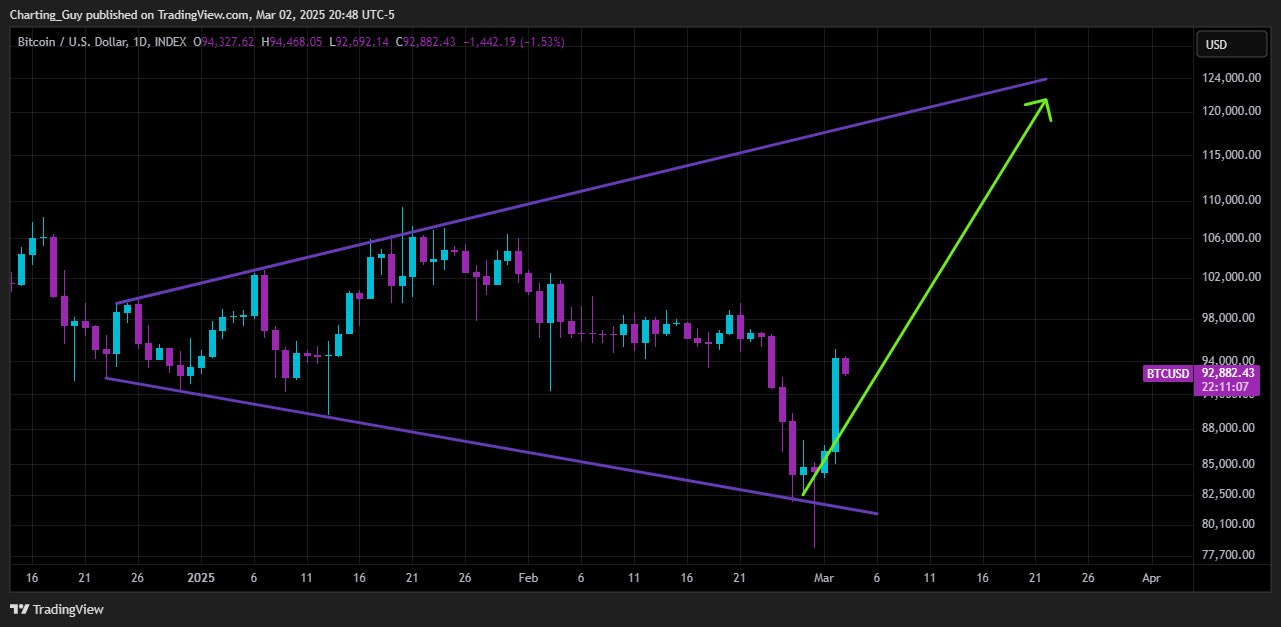
Bitcoin’s price action suggests a potential breakout after bouncing off a key support level within a rising wedge formation. The chart shared by Charting Guy on TradingView shows BTC/USD hitting a low of $88,000 before sharply reversing. As of the latest update, Bitcoin trades at $92,882, gaining strength after a steep decline. The price action indicates that bulls defended the lower trendline, potentially setting up BTC for a move toward $124,000 if resistance levels break.
Rising Wedge Formation Signals Potential Volatility
The chart displays a well-defined rising wedge structure, with BTC respecting both the upper and lower boundaries. The lower support trendline has held firm since early January, acting as a critical level where buyers step in. BTC’s latest dip below $90,000 saw an immediate rejection, evident from the long wick on the daily candle. This strong rebound suggests increasing bullish pressure, aligning with historical patterns where Bitcoin sees strong recoveries after testing major trendlines.
Presently, the upper end of the wedge, close to $124,000, holds strong as a pivotal resistance zone. If breached, Bitcoin could rise quickly to new highs; if this barrier is held, consolidation within the wedge could extend. As per volume trends, buying interest seems to be setting in, which could aid in any further upward mobility if the interests remain intact.
Market Sentiment and Technical Confluence
The green trajectory on the chart outlines a bullish scenario, projecting a sharp move toward the wedge’s upper resistance. Market sentiment appears to align with this outlook, with traders noting key confluences that support a breakout. Twitter user SerSned highlighted that BTC’s price action corresponds with a Wave 1–3 trendline, adding that the intersection occurs around a significant lunar cycle. While the lunar factor might not have scientific backing, the technical structure suggests Bitcoin is approaching a pivotal moment.
Not only does the rejection at $88,000 historically correspond to the support zone, thus adding strength to the bullish argument, but if Bitcoin can regain $100,000, it would serve as a springboard. The coming few trading sessions will judge whether BTC embraces the bullish projection or remains trapped within the wedge.
Next Move: Breakout or Range-Bound Action?
For Bitcoin to maintain its bullish momentum, it must break past $100,000 and sustain trading above this psychological level. If buyers push BTC beyond $110,000, the probability of testing $124,000 increases significantly. However, rejection at $100,000 could force Bitcoin back into the wedge, resulting in a period of sideways action or another retest of lower levels.
Given the sharp bounce and strong defense at support, bulls currently have the upper hand. A decisive breakout will confirm whether BTC is headed toward six-figure territory or facing another pullback. The coming days will be crucial in determining the next major move in Bitcoin’s price action.