
- The decline in bitcoin exchange reserves suggests possible supply pressure that might raise prices.
- Bitcoin is being moved off exchanges by investors, indicating a strong holding mood and the expectation of future price increases.
- After breaching significant resistance levels, a recurrent fractal pattern on the Bitcoin chart suggests that the market will continue to rise.
Bitcoin exchange reserves are melting down, and the market could soon witness a supply shock. According to Crypto Rover’s data on X, from April 2022 to early 2025, there is a persistent drop in reserves. It mirrors the price movement of Bitcoin that saw through $100,000 towards the end of 2024.
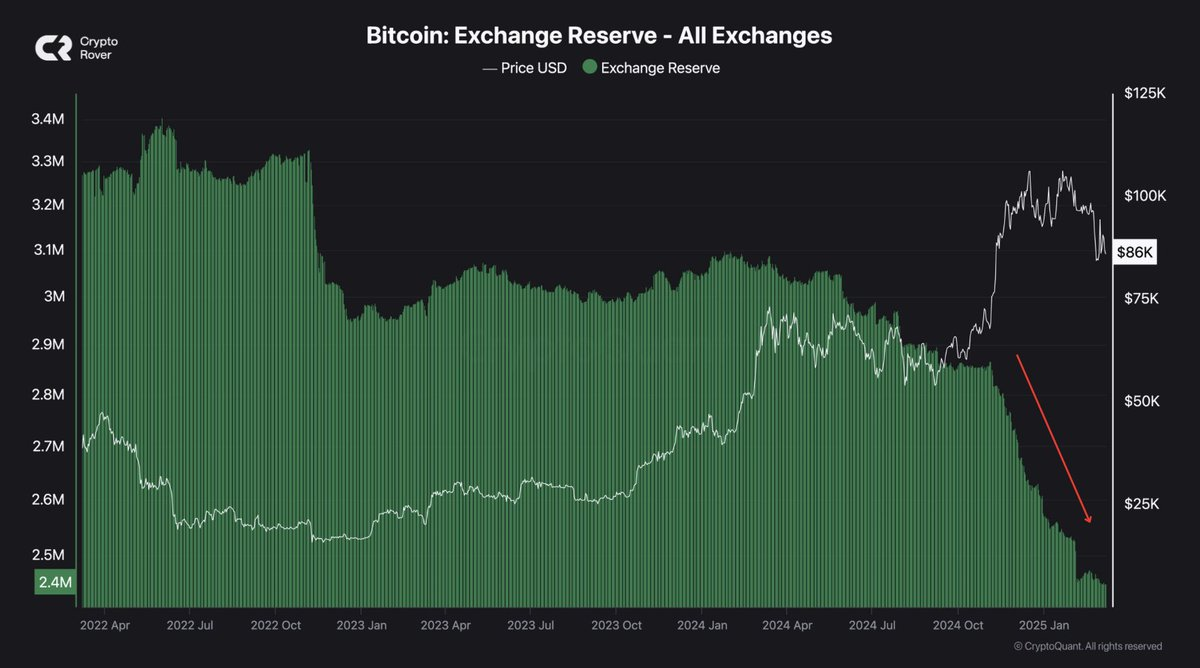
Bitcoin Reserves Decline as Prices Surge
During mid-2022, reserves in the Bitcoin exchange were around 3.3 million. But this declined slowly to a value of around 2.5 million during early 2023. Meanwhile, the price of Bitcoin was fluctuating between a range of $20,000 and $30,000. Reserves were reflecting stability at levels of 2.5 to 2.8 million Bitcoin during mid-2023. Conversely, the price of Bitcoin was reflecting steady uptrend advancement towards freshly established highs during late 2023 and early 2024.
In early 2024, Bitcoin reserves dipped below 2.4 million. Interestingly, the price broke above $100,000 in late 2024 before retracing modestly to $86,000. The exchange outflow indicates investors are keeping Bitcoin in private wallets, expecting further price gains. Thus, the declining exchange supply can propel further price momentum.
Bitcoin’s Fractal Pattern Indicates Strong Continuation
Analyst Javon Marks reveals repeating price action patterns in Bitcoin. A descending channel formation, followed by a breakout and consolidation, has appeared twice. The first occurrence led to sideways movement, while the second sparked a strong uptrend.
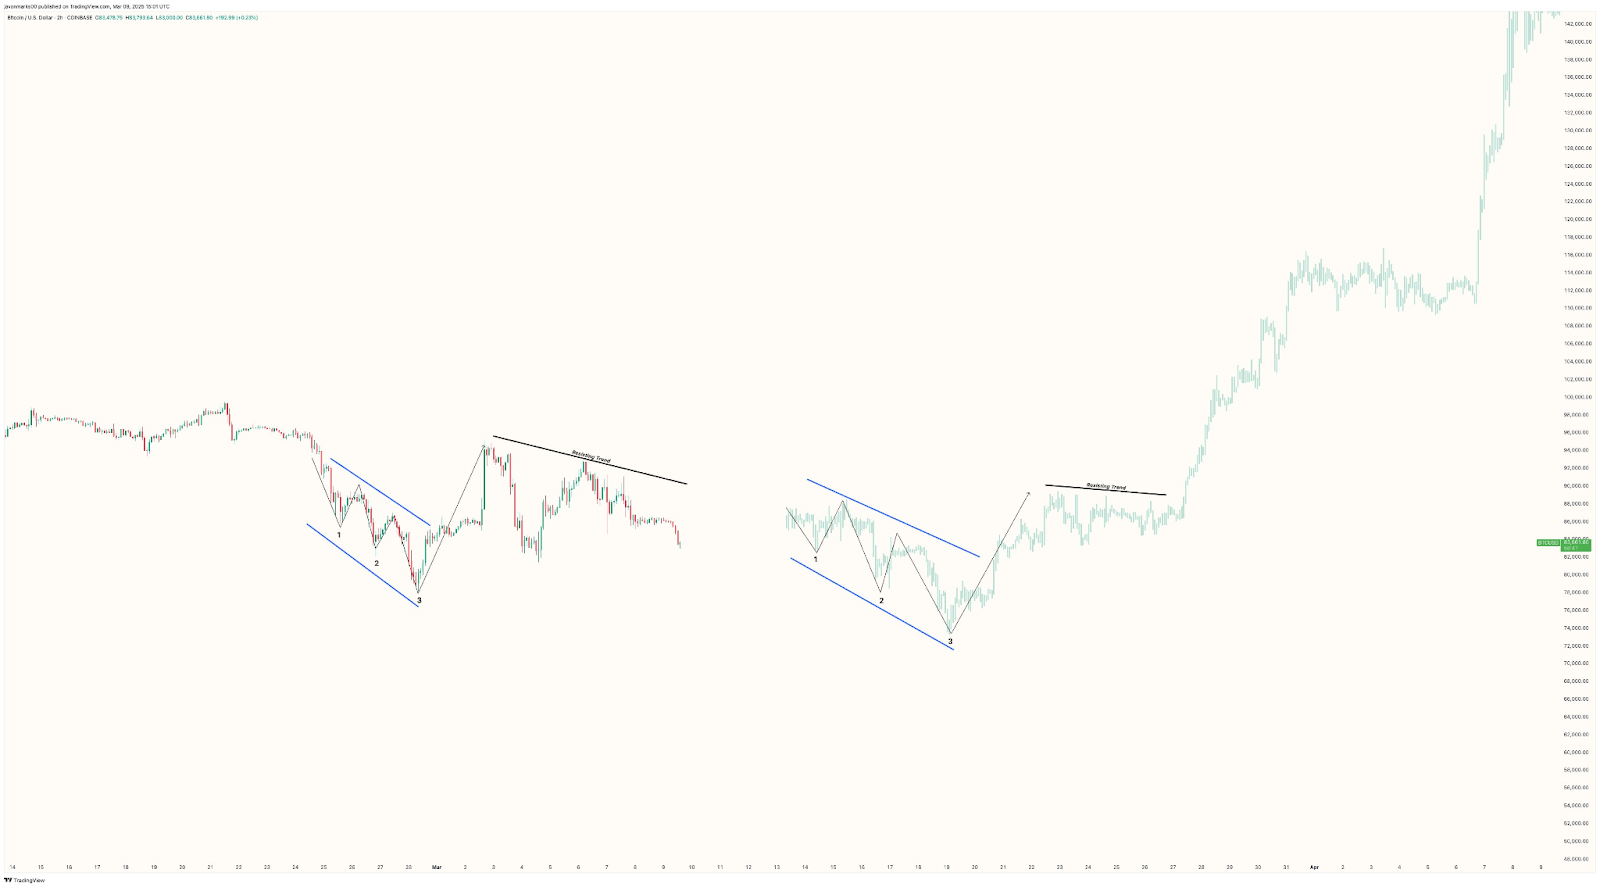
The left section of the chart displayed a falling wedge structure with three distinct touches on the lower boundary. Each bounce triggered a minor recovery before an eventual breakout. Bitcoin surged but faced resistance at a declining trendline. Following rejection, it retraced and consolidated below the resistance. The right section mirrors the left, showing an identical falling wedge pattern. Bitcoin followed the same sequence, bouncing three times before breaking out. Upon exiting the wedge, it rallied to the resistance trendline and consolidated. Unlike the previous instance, Bitcoin broke above the resistance and accelerated higher. This fractal formation suggests Bitcoin may continue its bullish trajectory.