
- Bitcoin shows strong buyer interest between $93K–$100K as on-chain data reveals heavy accumulation and rising bullish momentum.
- A broadening wedge pattern points to an incoming breakout, with Bitcoin building strength near key resistance around $100K.
- Market confidence returns after March’s steep drop, with BTC recovering and consolidating above strong support zones into late June.
Bitcoin has approached a key structural support zone between $93,000 and $100,000, according to recent on-chain data from Glassnode and technical data shown by analyst Convo. Glassnode reports dense accumulation within this price range during Q1 2025. Despite earlier volatility, the bullish market outlook is intact. After early January highs of $106,507, Bitcoin dropped to nearly $50,000 in mid-March. This 50% drawdown rattled investors and triggered market reactions. However, buyers returned strongly within the $50,000–$60,000 range.

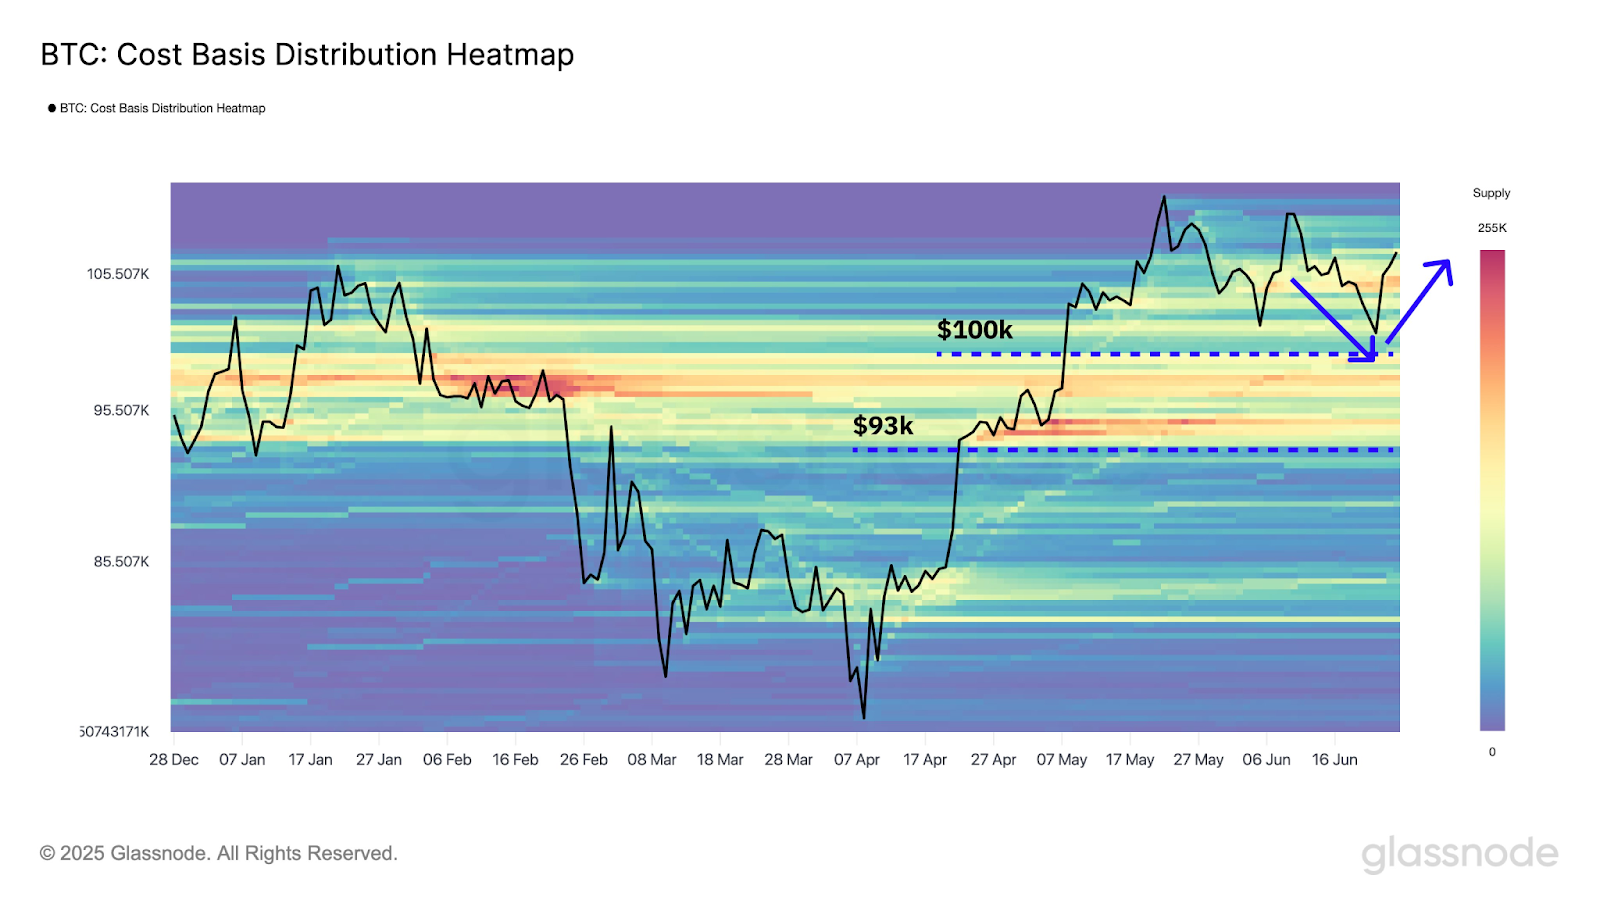
Source: Glassnode
Bitcoin’s cost basis heatmap shows warmer color concentrations near the $93,000 and $100,000 levels. These indicate intense buying pressure and strong psychological resistance. As June progresses, Bitcoin hovers near these levels, testing previously established support zones. Hence, current price behavior shows consolidation around critical thresholds. Besides, a visible supply buildup further supports the idea of a broader bullish continuation.
Accumulation Zones Signal Support Strength
Market participants accumulated heavily between $93,000 and $100,000. This supply behavior adds weight to those price levels as firm support. The 255K supply scale from Glassnode reveals the magnitude of Bitcoin holdings distributed across key ranges. Buyers stepped in during Bitcoin’s mid-March low, helping stabilize price action heading into Q2.
Additionally, heatmap data reflects evolving holder strategies. Warmer heat zones represent high supply densities, signaling accumulation phases. Cooler zones mark less activity, indicating short-term selling or low interest. Hence, these patterns provide insight into market direction and upcoming resistance or support levels.
Bullish Wedge Formation Gains Momentum
According to analyst Coivo, Bitcoin forms a descending broadening wedge on the 16-hour chart. This technical setup started in May near $92,000. The pattern features diverging trendlines, with lower support staying relatively flat. Meanwhile, upper resistance trends downward. Multiple price touches confirm the wedge structure’s reliability. Peaks near $112,000 upper resistance while dips around $97,000 define the wedge floor.
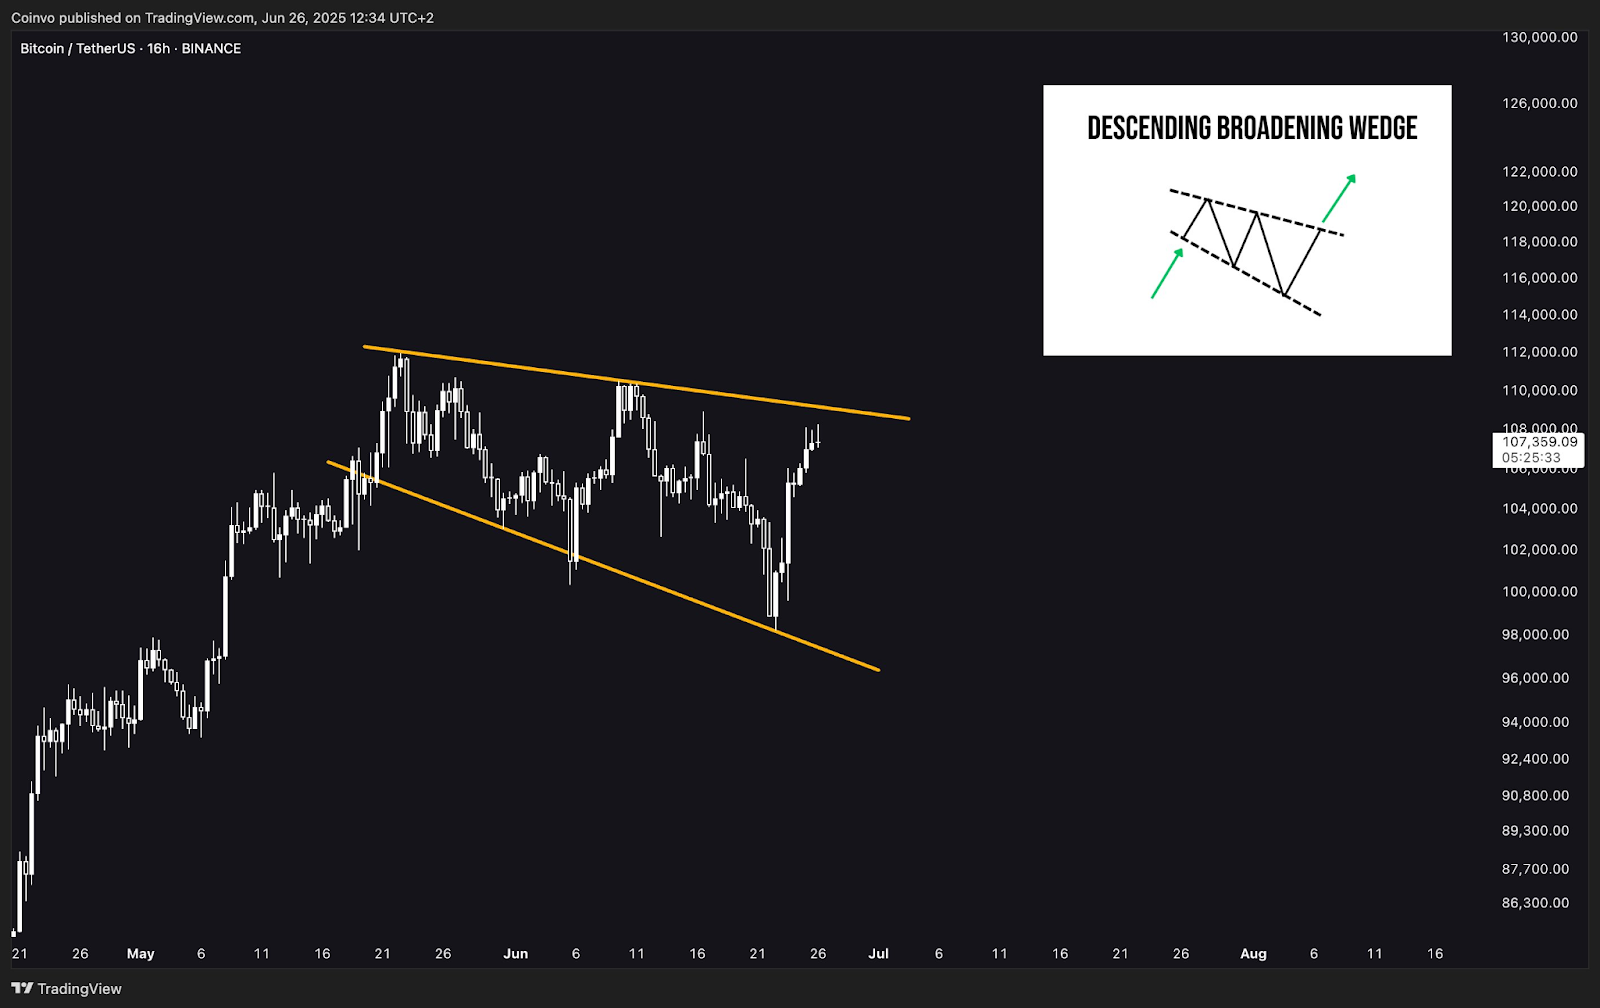
Source: Coinvo
Moreover, the pattern signals a bullish breakout once the upper resistance breaks. Recent price action shows momentum building near this resistance. Consequently, Bitcoin’s current positioning inside the wedge points to a potential breakout. If momentum holds, Bitcoin may soon breach the $100,000 level with increased force.