
- Bitcoin bounced at $112K, a key breakout zone supported by a March trendline, now acting as strong support.
- RSI at 46.46 and bearish MACD crossover indicate cooling momentum, hinting at possible short term weakness.
- Low trading volume and indecisive price action signal uncertainty, with $116K resistance and $112K support key to watch.
Bitcoin has had a technical rebound after a sharp pullback from recent highs, reclaiming strength at a key support level. The digital asset recently dropped to $112,000 after peaking just under $121,000 in mid July.

This decline occurred after price consolidated tightly within the $118,500–$121,500 zone. The bounce, however, came precisely at the point where a horizontal resistance flipped into support.
Rebound Forms at Breakout Point Near $112K
The $112,000 level had previously topped price action multiple times before the breakout in late July. After surpassing it, Bitcoin surged past $121,000, forming a new local high. Following that rally, price compressed within a tight range, a sign of momentum building.
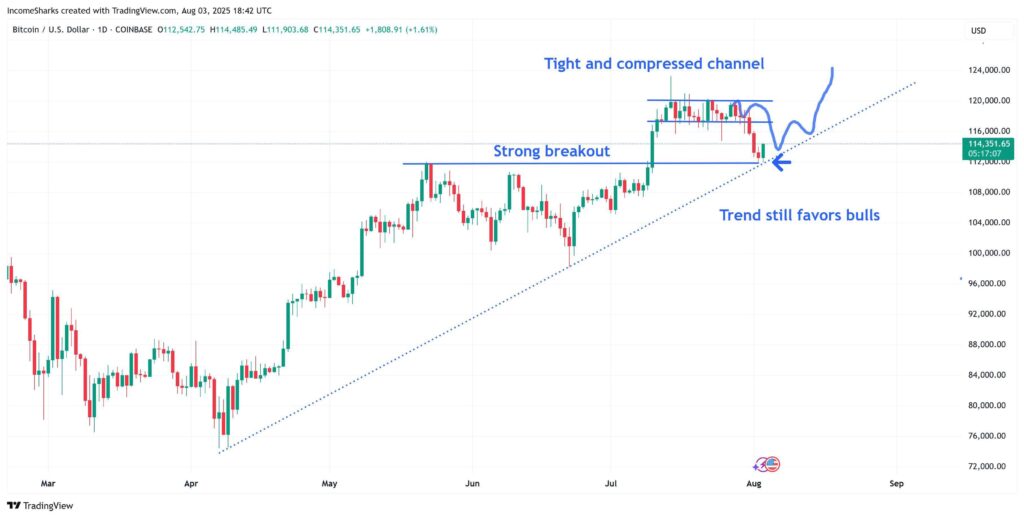
However, the rejection near $121,500 led to a pullback that returned the price to the breakout zone. The alignment with the long standing trendline from March supports this area as a technical support zone.
Analyst confirms that this rebound was anticipated, as the trendline and horizontal level converged around $112,000. A clean bounce has since occurred, with Bitcoin now trading at $114,299.28. This price is only a minor daily dip of 0.02%, suggesting indecision rather than clear weakness.
Momentum Cools as RSI and MACD Turn Bearish
Despite the bounce, momentum indicators are showing signs of fatigue. The RSI is at 46.46, dropping below 50. This suggests that bullish strength is diminishing, with momentum changing toward neutral or slightly bearish conditions.
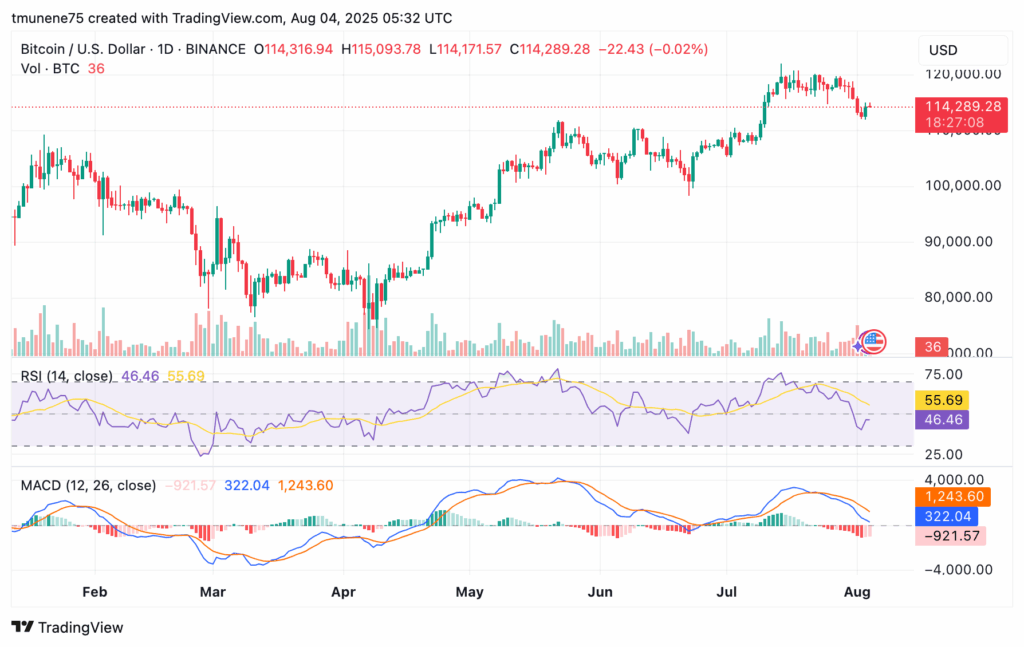
Additionally, the MACD indicator shows a bearish crossover. The MACD line now is below the signal line, and the histogram reads -921.57. This adds further evidence that the recent rally may be entering a cooling phase.
Price Action and Volume Show Uncertainty
Market size appears modest, with 36 BTC traded in the previous session. This below-average turnover suggests that the market is adopting a wait and see attitude. Since buyers and sellers are reluctant, Bitcoin’s near-term behavior could depend on how price acts against resistance near $116,000.
Staying above $112,000 upholds the broader trend in place, but rejection higher has the potential to put pressure on support at $105,000. In the meantime, technical levels and indicators unanimously concur that Bitcoin is at the point of decision-making, with leading metrics balancing bullish configuration against worsening momentum.