

- Bitcoin Q4 performance risks ranking among the weakest since 2018 if price fails to reach $100K by year-end.
- Liquidity clusters around $85K–$90K suggest leverage-driven volatility remains the dominant short-term market force.
- Momentum indicators show stabilization after a sharp flush, signaling compression rather than renewed directional conviction.
Bitcoin’s Q4 performance is under scrutiny as the year approaches its close. Its price is still below $100,000. Recent volatility, liquidity-driven moves, and tightening ranges suggest a market balancing. The market is not yet exhausted, but it remains with unresolved directional pressure.
Seasonal Patterns Frame Current Q4 Weakness
Bitcoin Q4 performance has historically benefited from strong seasonal tendencies. Data from prior cycles shows Q4 frequently acting as an acceleration phase during bull markets. Years like 2017 and 2020 recorded triple-digit percentage gains during this quarter.
Failure to reach $100K would place this quarter among the weakest since 2018. That comparison underscores how expectations remain anchored to historical upside-down behavior. The contrast highlights the current underperformance.
Bear-market years provide important context. In 2018 and 2022, Bitcoin experienced broad quarterly losses driven by leverage unwinds, similar in structure to recent volatility spikes.
Liquidity Clusters Continue to Dictate Price Action
Bitcoin Q4 performance is increasingly shaped by liquidity dynamics rather than trend strength. Binance liquidation heatmaps reveal dense leverage clusters above and below the current price. These zones act as magnets during periods of uncertainty.
Significant liquidity sits near $88K–$90K overhead and $85K–$86K below. Recent sharp declines align with price sweeping through these bands. Such moves triggered forced liquidations, accelerating downside momentum before stabilization.
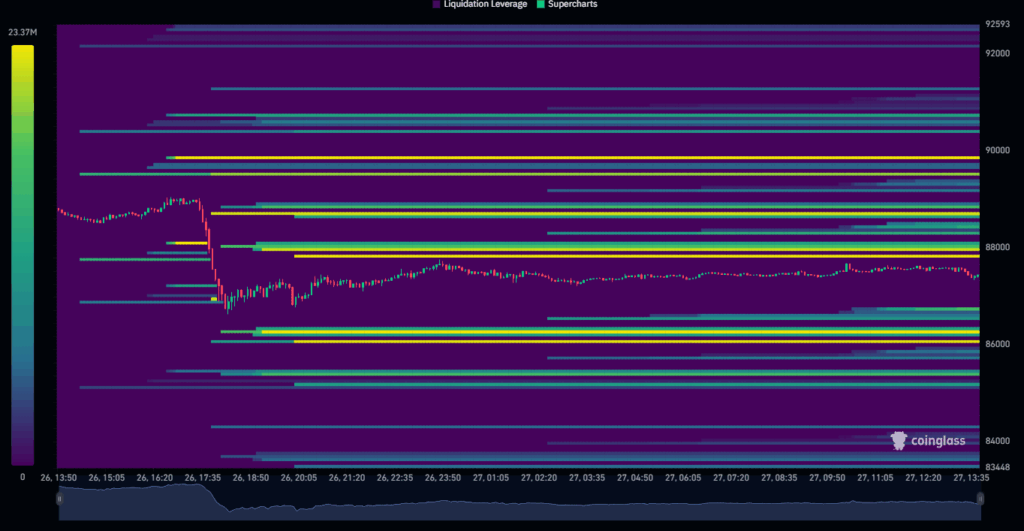
After the sweep, price entered a narrow consolidation range. Liquidity continues to rebuild rather than dissipate, suggesting another forceful move remains possible. Extended compression between leverage clusters often precedes aggressive expansion or breakdown.
Short-Term Charts Signal Compression After Volatility
Bitcoin Q4 performance on lower timeframes reflects a transition from expansion into consolidation. The 15-minute BTC/USDT chart shows two impulsive moves followed by sideways price action. These impulses cleared stops on both sides.
Momentum indicators support this stabilization narrative. The MACD displayed strong bearish expansion during the drop, then began flattening. Shrinking histogram bars suggest downside pressure has eased without flipping bullish.
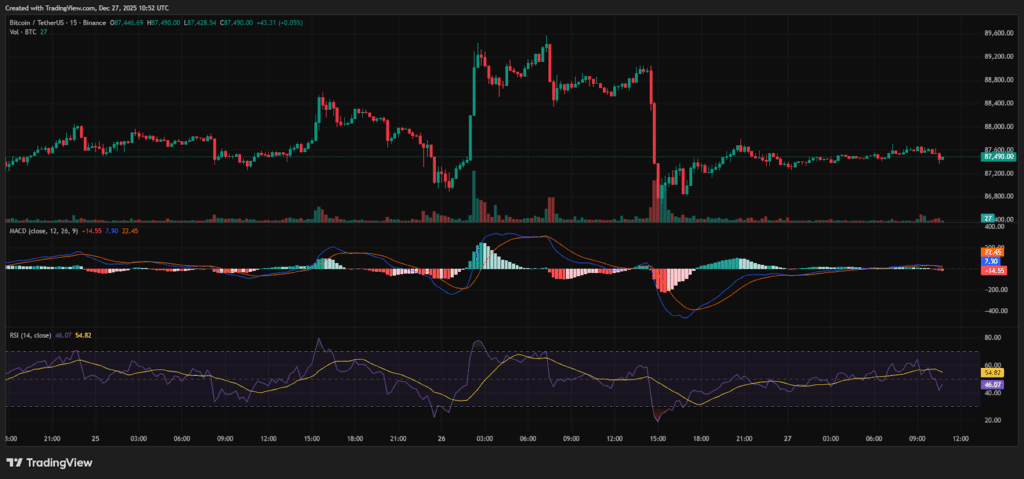
RSI rebounded from near-oversold levels into the mid-50s. This reading signals balance rather than trend. Holding above 50 aligns with short-term support during range-bound phases.
Volume confirms the shift in behavior. After capitulation spikes, activity contracted sharply. Reduced volume indicates emotional trading has passed, leaving the market waiting for a catalyst.
Bitcoin Q4 performance now reflects patience testing rather than trend confirmation. Price remains compressed, leverage remains active, and expectations remain elevated. Directional clarity depends on which liquidity zone price targets next, defining how the quarter ultimately closes.


