
- Bitcoin rebounds from $107K support and now eyes $112K resistance, setting the stage for a possible breakout toward $130K.
- Chart patterns from 2024 mirror current setup, hinting at a potential repeat rally if bulls reclaim $115K with strong momentum.
- Surge in hashrate and fresh institutional buying show growing confidence, adding strength to Bitcoin’s ongoing recovery attempt.
Bitcoin is once again at a crucial price level as traders try to figure out the next big move. After bouncing from the $107K–$108K support zone, BTC is slowly climbing, now trading around $109,400. The price of Bitcoin (BTC) is currently at $108,832,This reflects a slight 0.16% dip in the last 24 hours and a 0.27% decline over the past 7 days.The big question now—will Bitcoin break above key resistance or fall back into correction?

Bitcoin Faces Strong Resistance Ahead
Bitcoin is testing the 9-day EMA at $110,496 and is inching closer to the $111K–$112K resistance zone. This level is important because it was a breakdown point earlier and now acts as a major hurdle for the bulls. If BTC can close above this zone, there’s a chance it could rally towards the 50-day SMA at $115,735.
But sellers are still putting up a fight. The 50-day SMA is pointing down, which shows that overall market sentiment is still shaky. There’s been a small increase in buying volume during this recent move up—a positive sign—but it’s not convincing enough yet to call it a real breakout.If Bitcoin gets rejected again, it could slide back to retest $107K or even break down toward $105K.
Chart Pattern From 2024 Could Be Repeating
A side-by-side chart comparison from 2024 and 2025 shows an almost identical pattern. In 2024, Bitcoin broke out from a falling wedge and launched a major rally past $50K. This year, BTC formed a similar wedge and broke out near $110K. Now it’s trying to build momentum again.
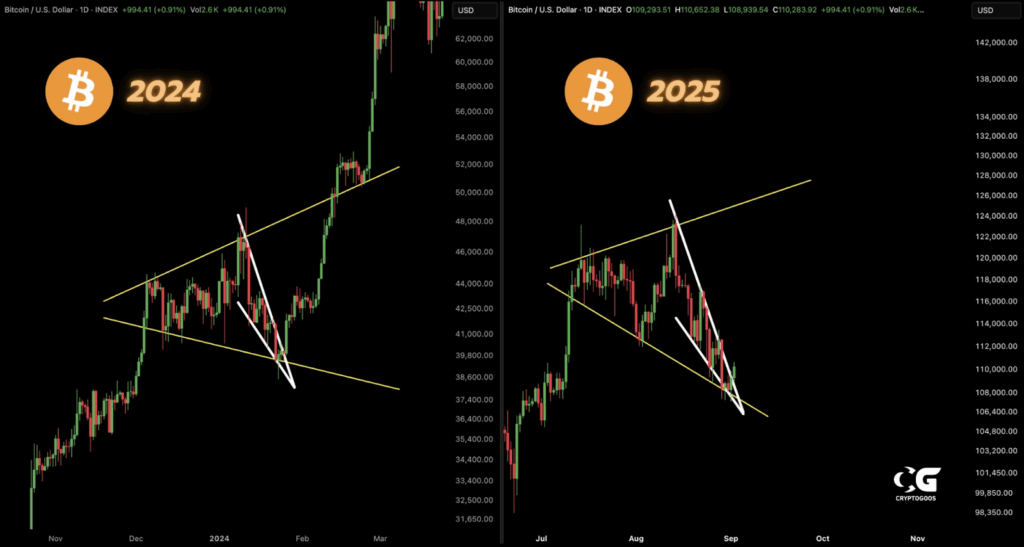
If Bitcoin manages to break above $112K and then pushes past $115K with strong buying volume, it could start to look a lot like the 2024 rally. Back then, a similar setup led to a sharp move higher—and this time, a breakout could open the door for a run toward $124K–$130K.
But until those levels are cleared, the market remains cautious. The total crypto market cap also reflects this, bouncing between $2.14T and $2.20T with no clear breakout.
Liquidations and Institutions Driving the Action
According to Coinglass, there are major liquidation levels at $107K and $114K. These zones attract big price moves, as traders with high leverage can get forced out. BTC already swept short positions near $110K, and if it moves higher, another wave of short liquidations could push it to $113K–$114K.
Meanwhile, institutions aren’t slowing down. MicroStrategy just added 4,048 BTC at an average of $110,981, bringing their total to 636,505 BTC. At the same time, Bitcoin’s hashrate hit a new record of 1.05 billion TH/s—showing strong miner activity and growing network strength.