
- Bitcoin’s on-chain activity slows as new address creation declines, signaling weaker network fundamentals.
- BTC supply in profit follows price trends, with downtrends leading to lower profitability and uptrends signaling recovery.
- The 90-day EMA net position change highlights market cycle shifts, reflecting profitability trends in Bitcoin’s network.
Ali_charts reports that the monthly average of new Bitcoin (BTC) addresses has dropped below the yearly average. This signals reduced on-chain activity. Consequently, this trend points to weaker network fundamentals and lower utilization.
Bitcoin Supply in Profit Declines
Bitcoin’s supply in profit shows a clear trend shift. The chart tracks BTC price movements, total supply in profit, and net position changes. The black line represents the BTC price in USD. Meanwhile, the gray line shows the total supply in profit. Additionally, the histogram displays the 90-day EMA net position change.
From April 2024, Bitcoin’s price surged. This pushed the total supply in profit higher. Furthermore, the net position change remained positive. However, by June 2024, a downtrend began. The price started declining, and the total supply in profit followed. The net position change turned negative, signaling reduced profitability.
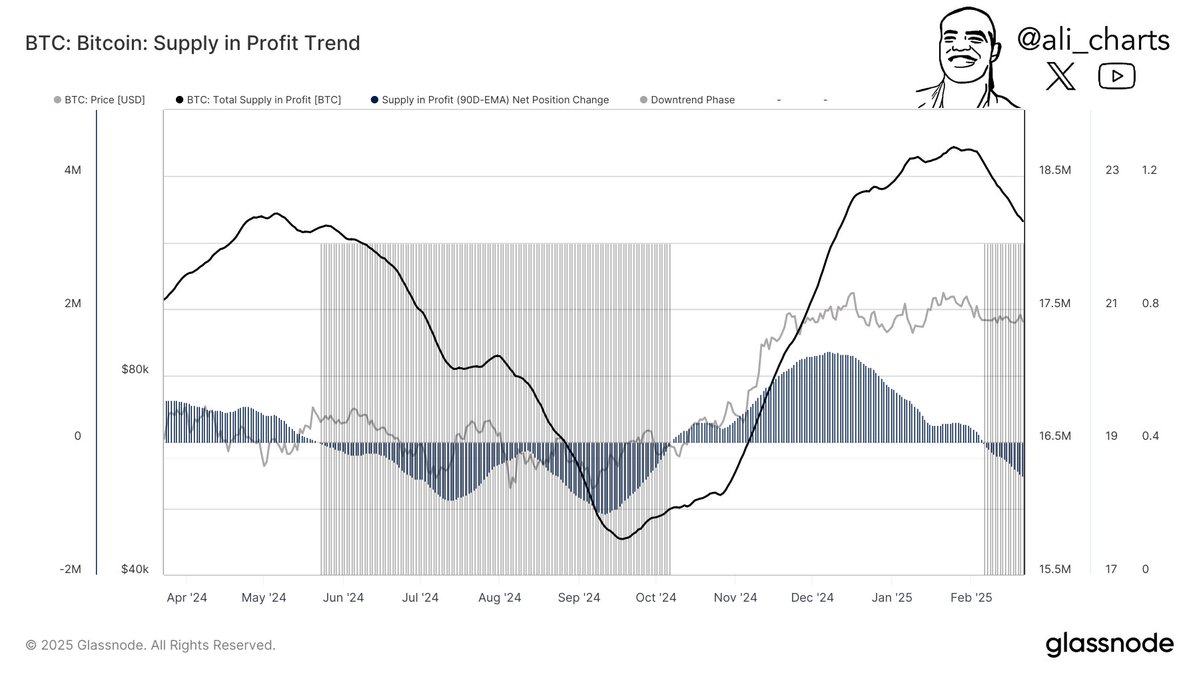
Between July and September 2024, BTC prices continued dropping. As a result, the total supply in profit shrank. The histogram deepened in negative territory. By October 2024, Bitcoin’s price began recovering. The total supply in profit stabilized, then started increasing. Notably, the net position change flipped positive, signaling growing profitability.
Market Cycles and Profitability Shifts
Bitcoin saw a strong rally from November 2024. Its price climbed significantly. Consequently, total supply in profit rose sharply. The net position change stayed positive, reflecting increased profitability. However, by January 2025, the BTC price peaked. It then experienced a slight pullback. Despite this, the total supply in profit remained elevated but showed signs of stabilization. Additionally, the histogram narrowed, indicating reduced positive momentum.
In February 2025, Bitcoin’s price declined again. This directly impacted the total supply in profit. As a result, the net position change turned negative. More supply moved out of profit. A new shaded downtrend phase appeared on the chart. This suggested a shift in market dynamics.
The correlation between BTC price and total supply in profit remains strong. Downtrend phases align with price drops. Conversely, uptrend phases show rising profitability. The 90-day EMA net position change provides key insights into market cycles. Moreover, it highlights profitability shifts within Bitcoin’s network.