
- Bitcoin whales are repositioning gradually, not panic selling, signaling steady market caution.
- Price bounced from $65K to over $70K, showing buyers see dips as strong entry points.
- Technicals hint mixed momentum; RSI near overbought, MACD positive, pullbacks are likely profit-taking.
Bitcoin’s price action turned heads as new on‑chain data showed key whale investors shifting their stance. According to CryptoQuant analyst _onchain, Bitcoin’s New Whales’ UPR dropped to –0.30. This decline matches a similar level last seen after the 2022 all‑time high. However, the pace and context differ meaningfully.
As per the data, the current move took over three months to reach –0.30, whereas in 2022 it happened in less than six weeks. Hence, the latest drop reflects a slower, more drawn‑out market response rather than a sudden crash. The prolonged slide signals that major holders may cautiously reduce risk or reassess exposure as prices fluctuate.
Gradual UPR Drop vs 2022 Crash
The UPR for Bitcoin’s New Whales turned negative before dropping to –0.30. In 2022, large entities reacted quickly after turmoil like the collapse of Luna and 3AC. Consequently, markets fell sharply then. However, now the downturn unfolded over three months.
Moreover, this suggests larger holders adjust slowly. Besides, gradual weakening can point to broader market hesitation. The indicator did not show frantic selling. Instead, it hinted at steady repositioning. Therefore, traders should weigh not just the level, but the context and speed of change.

Price Action Shows Mixed but Improving Tone
Although the price of Bitcoin moved erratically, it continued to rise on the 30-minute Bitstamp chart that was displayed on TradingView. At first, the price of Bitcoin dropped from the high $69,000 range to the mid-$66,000 range. The momentum showed that this phase was dominated by sellers.
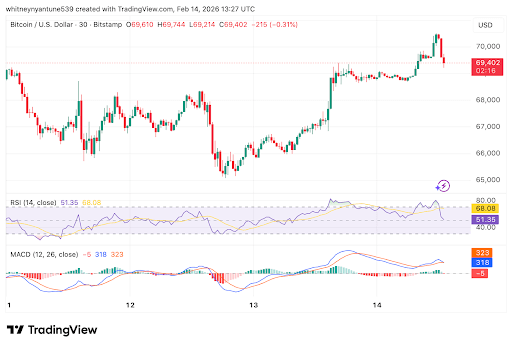
Buyers quickly appeared, though, and prices dropped back to between $67,000 and $68,000. Later, when the price of Bitcoin dropped to around $65,000, there was a spike in price volatility. Buyers began to arrive at this point, and prices began to rise once more. A sequence of higher lows followed, signifying an increase in momentum. The price of Bitcoin later surpassed $69,000 and even crossed the $70,000 threshold.
Technical Indicators Reflect Tension
Technical indicators’ strength varied during the rally. The Relative Strength Index (RSI) approached the overbought zone during the strong up moves. Hence, traders might have sensed the stretch in the markets for the short term.
Also, the MACD indicator turned positive during the up move. However, it flattened out as Bitcoin corrected slightly. The recent correction towards $69,400 looks more like profit-taking than a trend change. Moreover, corrections are normal after strong up moves.