
- Bitcoin’s loss margin at -15.4% suggests a potential rebound, aligning with past recovery patterns after deep negative margins.
- Historical trends show Bitcoin often surges after traders sell at losses, hinting at a possible market reversal in the near term.
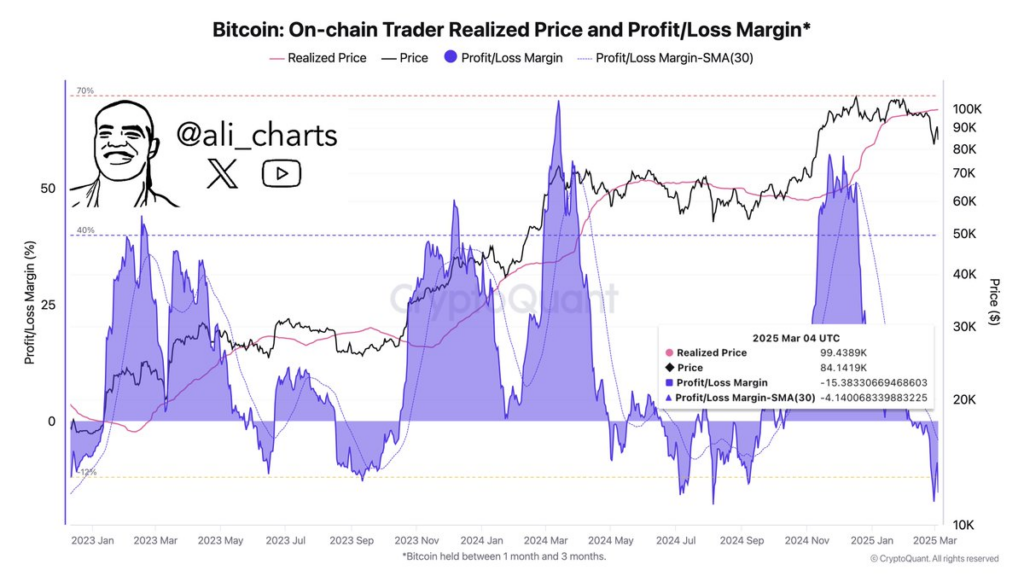
- The 30-day SMA of profit/loss margin at -4.14% reinforces ongoing market weakness but may signal an upcoming stabilization.
Bitcoin’s trader loss margin has plunged to -15.4%, hinting at a potential market reversal. Historically, Bitcoin rebounds when losses reach around -12%. As of March 4, 2025, Bitcoin’s realized price stands at $99,438, while the market price is $84,141. This deep negative margin signals traders selling below acquisition costs, mirroring past market corrections.
Market Trends and Profit Margins
Bitcoin’s on-chain trader realized price, market price, and profit/loss margin provide key insights into market movements. The realized price represents Bitcoin’s average acquisition cost over one to three months. The market price reflects Bitcoin’s actual trading value. The profit/loss margin shows the percentage difference between these two metrics, highlighting trader profitability.
Between January and March 2023, Bitcoin surged, pushing the profit margin over 40%. However, a correction followed, bringing the margin near 0% by mid-2023. Throughout the second half of 2023, fluctuations occurred, with occasional dips into negative territory. This indicated brief loss periods for traders before recovery phases began.
By December 2023, Bitcoin saw a second price peak, which produced a profit margin over 50% in the first quarter of 2024. Mid-2024, however, had a sharp drop in price that eliminated profits and reduced the margin. The margin is deeply negative by March 2025, showing generalized loss to Bitcoin traders during the last quarter.
Historical Cycles and Potential Reversal
Bitcoin’s price cycles indicate that deep negative margins often precede bullish recoveries. Previous instances show that prolonged negative profit margins stabilize prices before upward movements begin.
Moreover, historical patterns reveal that steep profit margin drops frequently lead to market rebounds. Additionally, the 30-day simple moving average (SMA) of the profit/loss margin sits at -4.14%, reinforcing the ongoing negative trend.