
- Bitcoin tests key support between $82K and $86K, forming a descending channel before a slight rebound.
- A head and shoulders pattern signals a potential breakout if Bitcoin surpasses the neckline. Resistance stands near $95K.
- Fibonacci levels and trendlines shape Bitcoin’s price action, with resistance at $105K, $117K, and $130K.
Bitcoin is above the $86,413 support level, signaling potential for further upside. It is trading at $84,013.70 after a decline of 1.74%. The price movement forms a descending channel, with Bitcoin testing a key support zone before rebounding slightly. Currently, the horizontal support lies between $82,000 and $86,000, stabilizing price activity.
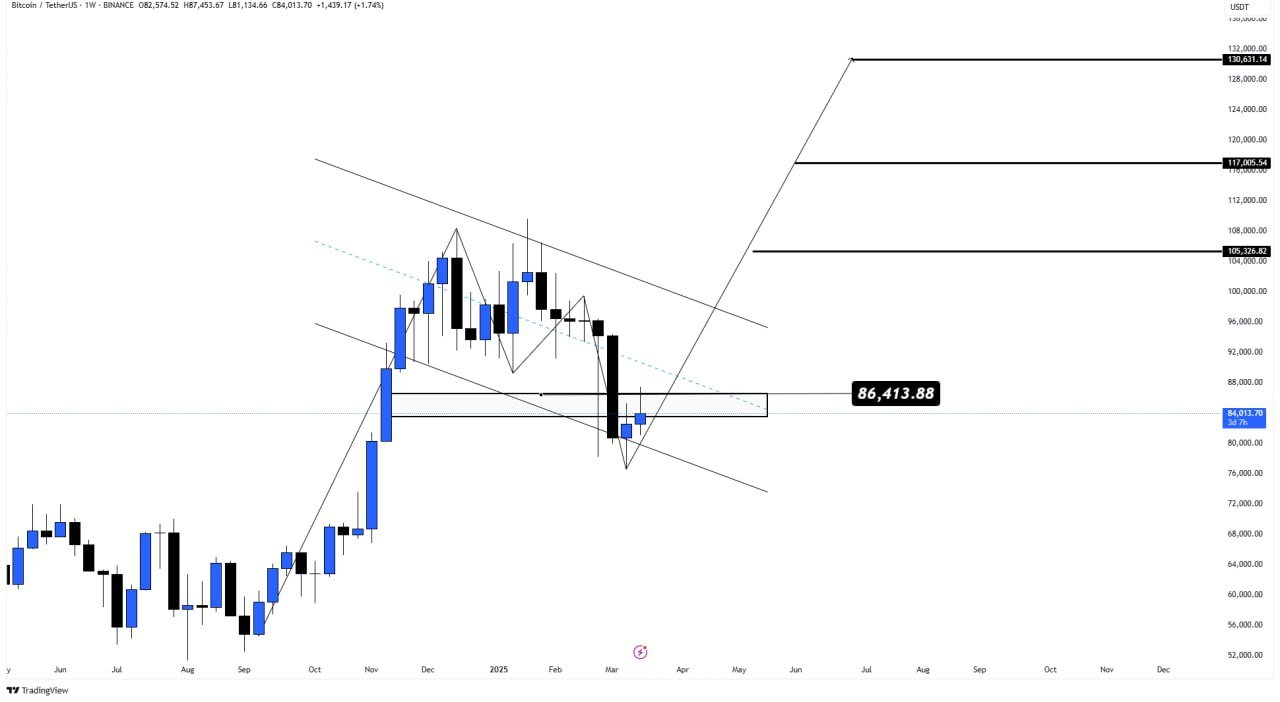
Bitcoin’s Key Resistance and Target Levels
Bitcoin’s first major resistance stands at $105,368.82, followed by $117,005.54 and $130,631.44. These levels align with Fibonacci extensions and previous market structures. Bitcoin previously peaked near $87,453.67 before retracing toward the lower boundary of the descending channel.
The candlestick structure indicates alternating bullish and bearish momentum. A strong bearish move pushed the price to the lower trendline before a minor bullish reaction emerged. This consolidation zone suggests accumulation before a breakout. The Fibonacci levels and trendline structure indicate potential areas of price reaction.
Head and Shoulders Pattern Signals Potential Breakout
A head and shoulders pattern has developed on Bitcoin’s daily chart. The current price of $84,477.41 reflects a slight gain of 0.32%. This pattern includes a left shoulder, head, and right shoulder, with the neckline extending along a diagonal trendline intersecting Fibonacci retracement levels.
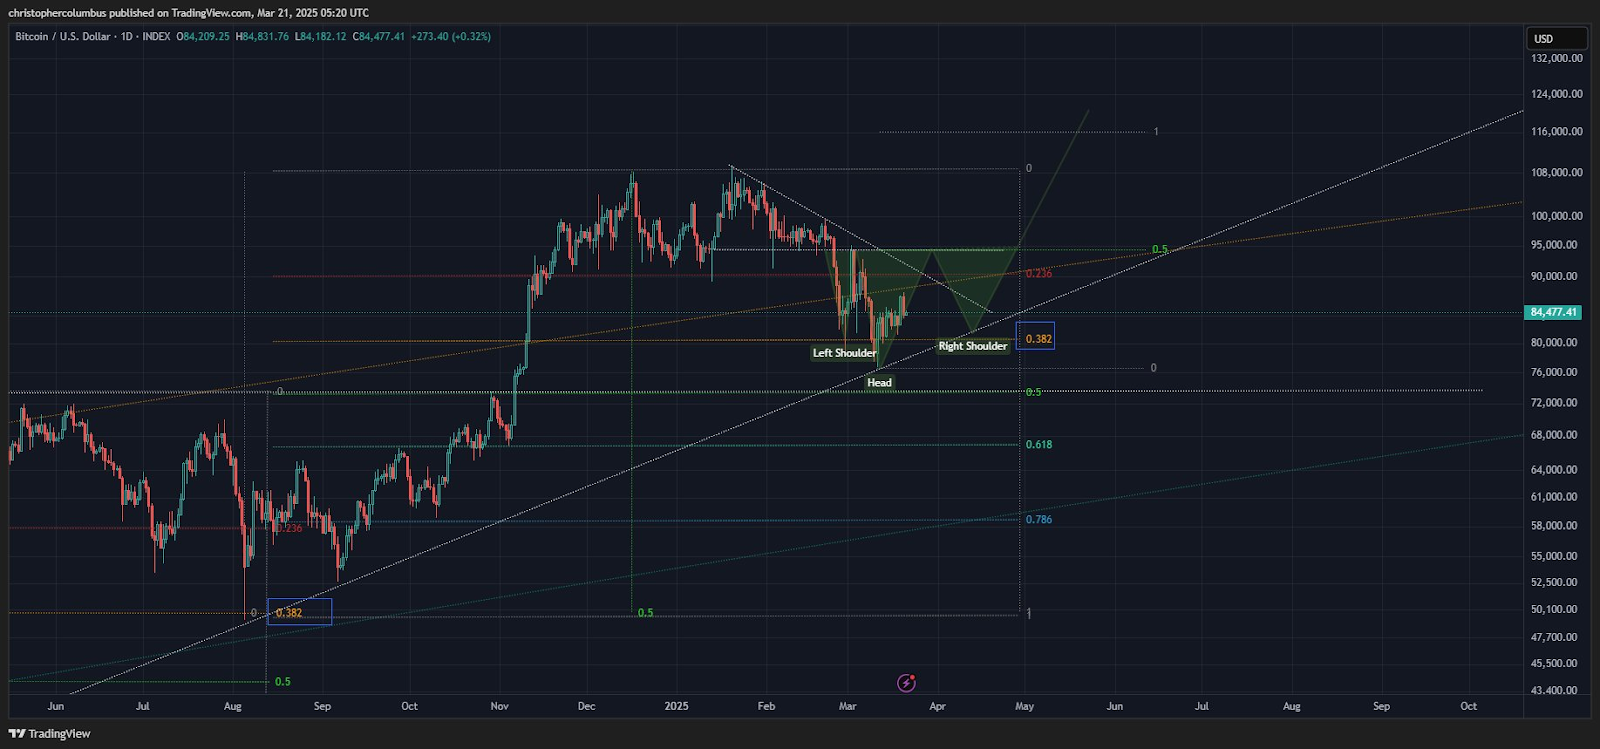
Before falling into the present configuration, Bitcoin peaked at around $90,000. Near $80,000, the price bounced back from support and reached the Fibonacci retracement level of 0.382. According to trendlines and Fibonacci retracement levels, the market stays in a structured pattern.
Several trendlines shape Bitcoin’s price action. An ascending trendline extends from a previous low, while a long-term resistance line intersects near the breakout zone. If Bitcoin breaks above the neckline, it could rally toward $95,000. A rejection at this level may lead to further consolidation.