
- Bitcoin trades above $115K, with analysts warning of $93K if support fails and $137K if resistance breaks.
- MVRV bands show Bitcoin in a moderately elevated zone, supporting a bullish structure since late 2022.
- Resistance near $123K and $137K could cap gains, while supports at $114K and $111K attract strong accumulation interest.
Bitcoin trades in a narrow range where support and resistance levels might define its next major move. Current market positioning shows the asset priced slightly above the 0.5 deviation band at $115,439, while resistance aligns with the +1.0σ band at $137,302.
According to analyst Ali, $115,440 is the most important support, with upside potential toward $137,300 if held. However, a break below this area could send the price toward $93,600, aligning with the mean valuation level of $93,576.
Pricing Bands and Market Levels
The MVRV Extreme Deviation Pricing Bands provide the framework for Bitcoin’s present valuation. Constructed around the realized price of $53,344, the bands identify statistically defined zones of overvaluation and undervaluation.
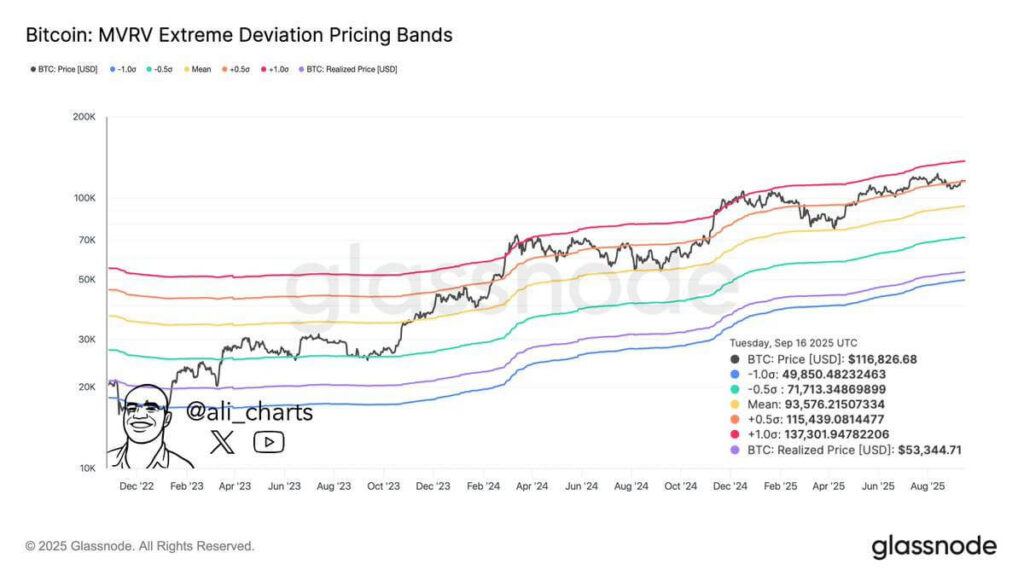
Bitcoin’s current level suggests moderate optimism but not an extreme overvaluation phase. The upward movement since late 2022 has supported the broader bullish structure.
Breaks above the mean in early 2024 were sustained, and corrections consistently found support near lower deviation bands. This pattern shows how pricing bands are influencing short term momentum while anchoring long term trend behavior.
Resistance and Support Zones
Analyst Michael van de Poppe emphasized that Bitcoin is retesting a key resistance zone after rebounding from $111,918. Historical price action shows this region has repeatedly led to rejections, adding weight to its importance.
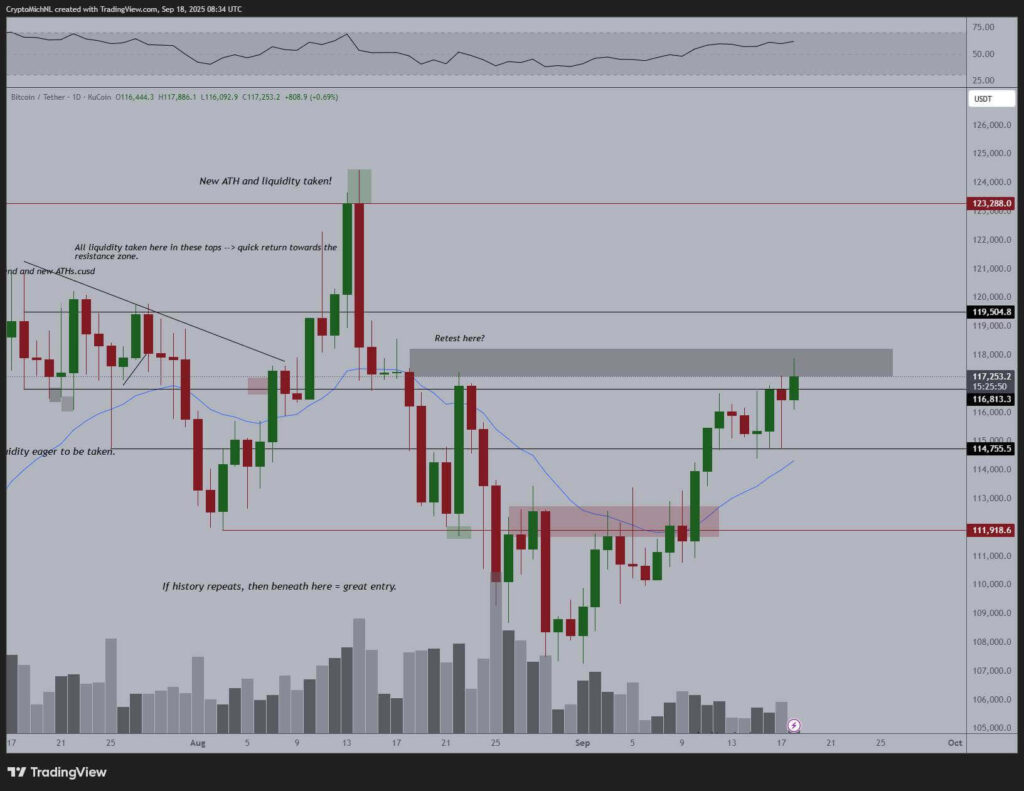
Above this zone, $123,288 is a key level tied to a previous all-time high and sharp reversal. On the downside, immediate support is at $114,755, with stronger accumulation zones forming near $111,918.
According to the chart, any dips below these areas could attract significant buying, as seen during earlier pullbacks. These levels therefore form a clear structure between short term resistance and deeper liquidity support.
Indicators Point to Market Readiness
Volume analysis shows momentum has increased during the latest rally, confirming strong market activity. Additionally, the RSI continues to trend upward but remains outside extreme overbought conditions.
This alignment suggests Bitcoin has potential for price expansion without immediate risk of exhaustion. Together, these technical indicators highlight the delicate balance between support and resistance.
While the $115,440 level acts as a pivot for bullish continuation, overhead barriers near $123,288 and $137,302 will likely determine whether the rally extends further or retraces toward lower valuation bands.