
- Bitcoin confirms a multi-year cup and handle breakout with $84K retest acting as support, setting sights on a $175K target zone.
- Technical structure shows consistent higher lows and 50-week MA support, reinforcing bullish momentum into mid-2025 and beyond.
- With a historical pattern unfolding, Bitcoin may gradually climb toward $170K–$200K, aligning with realistic Fibonacci-based targets.
Bitcoin recently underwent a textbook multi-year cup and handle pattern, shaping the possibility of a big breakout, as confirmed by Stockmoney Lizards. Ever since the breakout, it has shattered a 4-year resistance formed at $60,000 to $70,000. This breakout also witnessed a clean retest, now acting as support near $84,000. So, this bullish structure puts Bitcoin in a prime spot for a rally toward $175,000 somewhere in the coming months.

The breakout pattern gained shape between late 2021 and early 2024. Bitcoin first failed to break the $60K-$70K resistance in 2021. It then plunged in 2022, forming the bottom of the cup. However, it began recovering through 2023, forming the right side of the cup. By early 2024, Bitcoin revisited the resistance zone, completing the handle before breaking out with strength.
A Clean Retest Confirms the Breakout
Besides the breakout, the price action included a crucial retest around $84,000. That level, once resistance, flipped into solid support. Consequently, this confirmed the validity of the pattern. The retest also cleared weak hands, resetting market sentiment. Moreover, the 50-week moving average has held as dynamic support throughout this cycle. Bitcoin has continued to post higher lows, suggesting sustained accumulation.
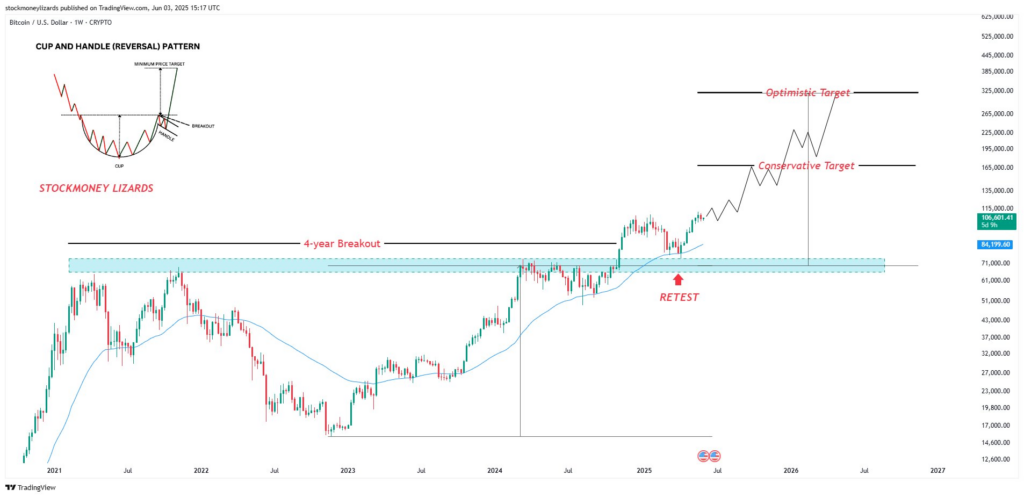
Source: Stockmoney Lizards
By June 2025, Bitcoin trades around $106,600, maintaining weekly gains. The bullish momentum remains intact as long as price stays above the breakout zone. Significantly, the cup and handle pattern carries strong historical weight. It has previously marked powerful macro reversals across different markets.
Targets Suggest Room for Growth
The pattern suggests two key upside targets. A conservative target stands near $175,000. This projection reflects the depth of the cup and historical Fibonacci extensions. Additionally, an optimistic target points toward $325,000. However, such a move requires strong continuation and wider market alignment.
Still, the market often rejects the most bullish outcomes. Hence, traders should view the $170K–$200K range as more realistic. Besides, Bitcoin tends to move in staircase fashion—higher highs followed by consolidation. This pattern supports a gradual climb rather than a parabolic spike.
The 4-year resistance flip now forms a strong foundation. Bitcoin’s long-term technical landscape looks increasingly bullish as price trends higher. If the pattern plays out fully, this breakout could shape the next major leg of the cycle.